1. 概述
quarkus-load-shedding 擴展 提供了一種在應用程序或服務在高流量條件下,主動拒絕請求的機制,以防止系統過載的方法。該庫還暴露了關鍵的配置屬性,以幫助自定義負載削減的處理方式。
在本教程中,我們將探討如何將此擴展集成到我們的 Quarkus 應用程序中,並自定義其配置以滿足我們的特定需求。
2. 安裝
為了演示 quarkus-load-shedding 擴展的關鍵特性,我們將使用兩個作為 REST 端點暴露的 Web 資源:FibonacciResource 和 FactorialResource。 每當調用這些資源時,它們會在返回結果之前引入一個 1 到 15 秒的隨機響應延遲。
讓我們首先將擴展作為對我們 Quarkus 項目的 依賴項 添加:
<dependency>
    <groupId>io.quarkus</groupId>
    <artifactId>quarkus-load-shedding</artifactId>
</dependency>
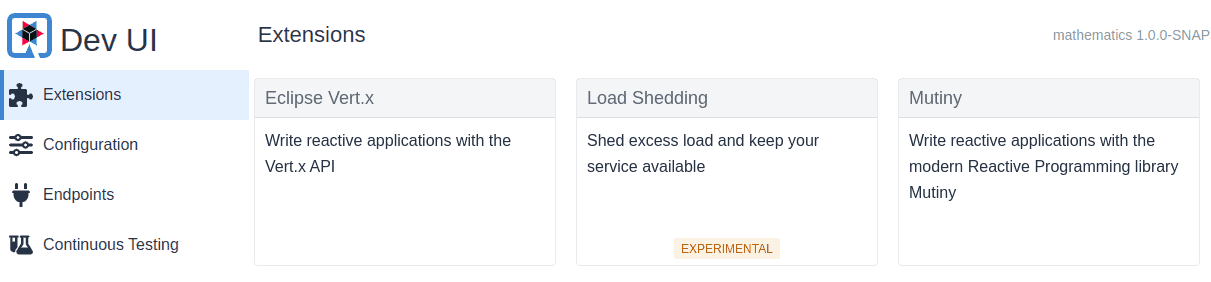
當我們以開發模式啓動應用程序時,我們應該能夠在 Dev UI 上看到擴展:
./mvnw quarkus:dev截至寫作時,此擴展仍處於實驗狀態:
3. 默認負載削減
添加擴展後,它默認啓用。它將開始使用默認配置進行請求削減。
讓我們調整此配置使其更嚴格,通過編輯 application.properties 文件:
quarkus.load-shedding.enabled=true
quarkus.load-shedding.max-limit=10
quarkus.load-shedding.initial-limit=5
此配置設置了允許的併發請求的初始和最大限制。 max-limit 設置併發請求的邊界,而 initial-limit 主要用於計算可接受的隊列大小。
現在,讓我們通過 JMeter 測試我們的配置,調用這兩個端點。在 JMeter 中,我們設置了 7 個用户線程,以兩次運行,並設置了 5 秒的 ramp-up 期間:
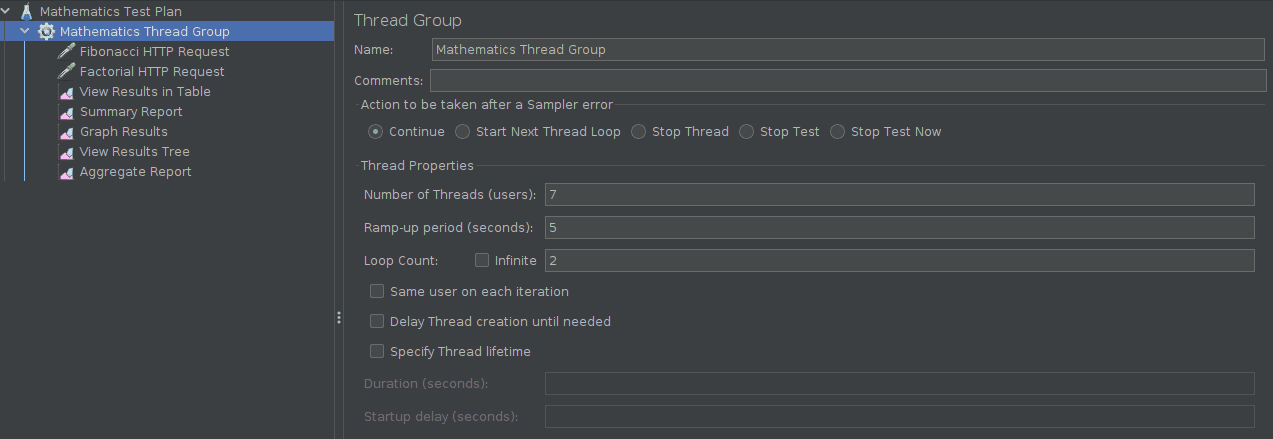
運行此測試計劃,我們得到下面的結果,顯示 HTTP 503 錯誤率在兩個端點之間均勻分佈。
| Label | # Samples | Average | Min | Max | Std. Dev. | Error % |
|---|---|---|---|---|---|---|
| Fibonacci HTTP Request | 14 | 5735 | 2 | 12613 | 4517.63 | 28.571% |
| Factorial HTTP Request | 14 | 5195 | 1 | 11470 | 4133.69 | 28.571% |
| TOTAL | 28 | 5465 | 1 | 12613 | 4338.33 | 28.571% |
quarkus-load-shedding 擴展根據 application.properties 中的配置,無差別地拒絕了請求。
4. Custom Load Shedding
The extension exposes a few configurations that enable us to customize the load-shedding behavior. One such feature is the ability to prioritize which requests should be shed when the system is under heavy load. Let’s take a look at this in the next subsection.
4.1. Request Prioritisation
First, let’s enable the priority setting in our file:
# ...
quarkus.load-shedding.priority.enabled=true
Now, let’s provide an implementation of the to specify our request priority:
@Provider
public class LoadRequestPrioritizer implements RequestPrioritizer<HttpServerRequestWrapper> {
    @Override
    public boolean appliesTo(Object request) {
        return request instanceof HttpServerRequestWrapper;
    }

    //...
}
Our class is annotated with as a CDI bean so that the runtime can automatically discover it. We also specified that it should only process type requests.
Next, we assign a priority to a specific target endpoint:
@Provider
public class LoadRequestPrioritizer implements RequestPrioritizer<HttpServerRequestWrapper> {
    //...
    @Override
    public RequestPriority priority(HttpServerRequestWrapper request) {
        String requestPath = request.path();
        if (requestPath.contains("fibonacci")) {
            return RequestPriority.CRITICAL;
        } else {
            return RequestPriority.NORMAL;
        }
    }
}
Therefore, the / endpoint will have a higher priority than the other endpoints, which means requests to that endpoint are less likely to be rejected than the others.
4.2. Trigger Load Detection
Since the extension applies priority load shedding only when it detects the system is under stress, next, let’s simulate a CPU load:
@Path("/fibonacci")
public class FibonacciResource {
    //...
    @PostConstruct
    public void startLoad() {
        for (int i = 0; i < Runtime.getRuntime().availableProcessors(); i++) {
            new Thread(() -> {
                while (true) {
                    Math.pow(Math.random(), Math.random());
                }
            }).start();
        }
    }
}
When first called, the of the triggers a CPU-intensive task to ensure the CPU remains under load during the test. After restarting the application, let’s trigger an initial request to the endpoint:
curl -X GET http://localhost:8080/api/fibonacci?iterations=9
Next, we execute the JMeter test plan again with the same values, producing the results below:
| Label | # Samples | Average | Min | Max | Std. Dev. | Error % |
|---|---|---|---|---|---|---|
| Fibonacci HTTP Request | 14 | 5848 | 9 | 13355 | 4280.47 | 14.286% |
| Factorial HTTP Request | 14 | 6915 | 10 | 14819 | 5905.41 | 28.571% |
| TOTAL | 28 | 6381 | 9 | 14819 | 5184.86 | 21.429% |
As shown in the table, the rejection rate was lower on the / endpoint due to its higher priority.
4.3. System Probe Rate
The config influences how often the extension probes or checks for fluctuations in the system’s request-handling capacity.
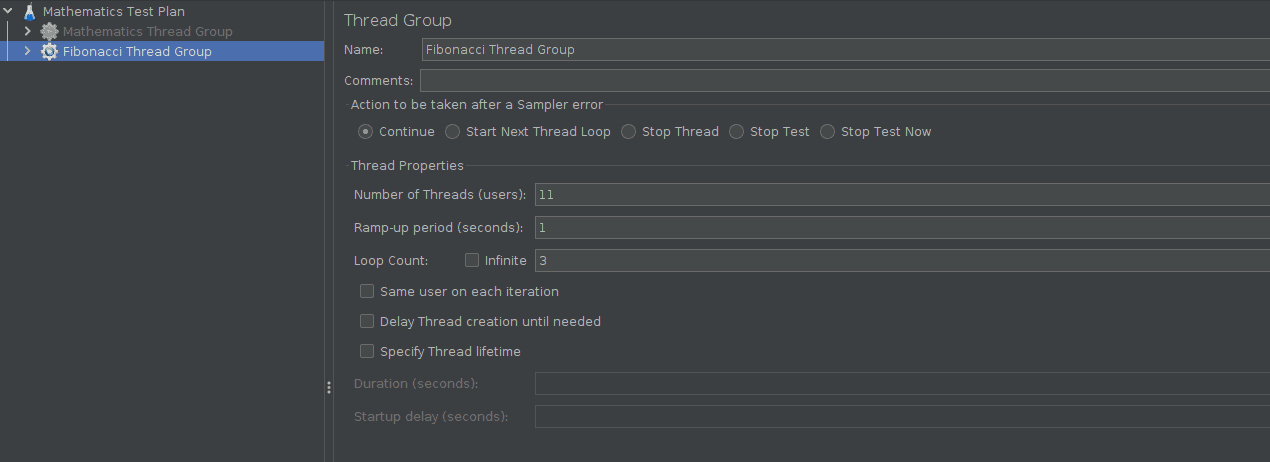
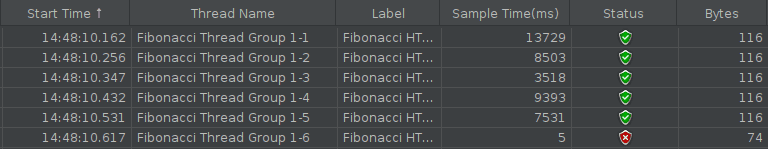
By default, the is set to 30. To compare the effects of this setting, let’s first run a JMeter test on the only, with 11 user threads:
Let’s look at the results after running the JMeter test plan:
| Label | # Samples | Average | Min | Max | Std. Dev. | Error % |
|---|---|---|---|---|---|---|
| Fibonacci HTTP Request | 33 | 8236 | 3 | 14484 | 4048.21 | 9.091% |
| TOTAL | 33 | 8236 | 3 | 14484 | 4048.21 | 9.091% |
As expected, only three requests (i.e., samples x % error rate) were rejected because we configured the maximum allowed concurrent requests as in our file.
Let’s now increase the from its default value of in the file:
quarkus.load-shedding.probe-factor=70
Then, let’s rerun our previous JMeter test using the same setup and examine the results:
| Label | # Samples | Average | Min | Max | Std. Dev. | Error % |
|---|---|---|---|---|---|---|
| Fibonacci HTTP Request | 33 | 6515 | 11 | 13110 | 3850.50 | 6.061% |
| TOTAL | 33 | 6515 | 11 | 13110 | 3850.50 | 6.061% |
This time, only two requests were rejected. Setting a high makes the system less sensitive to fluctuations in load.
4.4. Queue Management
The and configurations control how the limit is incremented and decremented (from the initial to the maximum limit) based on the observed request queue size. To see their effect, let’s add them to our file:
quarkus.load-shedding.alpha-factor=1
quarkus.load-shedding.beta-factor=5
Rerunning our previous JMeter test with 11 user threads from the previous section, we get the following result:
5. 結論
在本文中,我們瞭解到如何將 quarkus-load-shedding 擴展集成到我們的 Quarkus 應用程序中,從而使我們的系統在負載下能夠有效響應。我們還學習瞭如何自定義擴展以滿足我們的需求,通過調整其配置屬性,並對每個屬性的含義有了更深入的理解。
