

大家好,我是“蔣點數分”,多年以來一直從事數據分析工作。從今天開始,與大家持續分享關於數據分析的學習內容。
本文是第一篇,也是【SQL 週週練】系列的第一篇。該系列是挑選或自編具有一些難度的 SQL 題目,一週至少更新一篇。後續創作的內容,初步規劃的方向包括:
後續內容規劃
1.利用 Streamlit 實現 Hive 元數據展示、SQL 編輯器、 結合Docker 沙箱實現數據分析 Agent
2.時間序列異常識別、異動歸因算法
3.留存率擬合、預測、建模
4.學習 AB 實驗、複雜實驗設計等
5.自動化機器學習、自動化特徵工程
6.因果推斷學習
- .……
歡迎關注,一起學習。
第 1 期題目
題目來源:Uber 面試真題
一、題目介紹
有一張表,記錄了乘客對於司機的評價,請找出每個星期當中連續獲得 5 星好評最多的 driver_id。列名:driver_id、rating_time、ratings (原題乘客 id 對解答題目是冗餘的,故此我在文中省略掉...)連續 5 星,中間出現任意一次非 5 星,則中斷。
二、題目思路
想要答題的同學,可以先思考答案🤔。
.……
.……
.……
我來談談我的思路,“連續”問題是數據分析師在 SQL 筆試中的“老朋友”了。最常見的就是“連續登錄”問題,其大概思路是利用日期減去排序row_number()得到一個“基準日期”用來作為分組標識。這裏沒有日期,不能生搬硬套。
我們思維變通一下,如果想將連續計數的記錄能夠放在同一個組裏,那麼這個分組標識是關鍵。對於連續 5 星,它們的有什麼共同點?是每一個 5 星評價前面有多少個非 5 星(1~4 星)的評價。為了方便理解,我繪製一個簡易的説明圖:
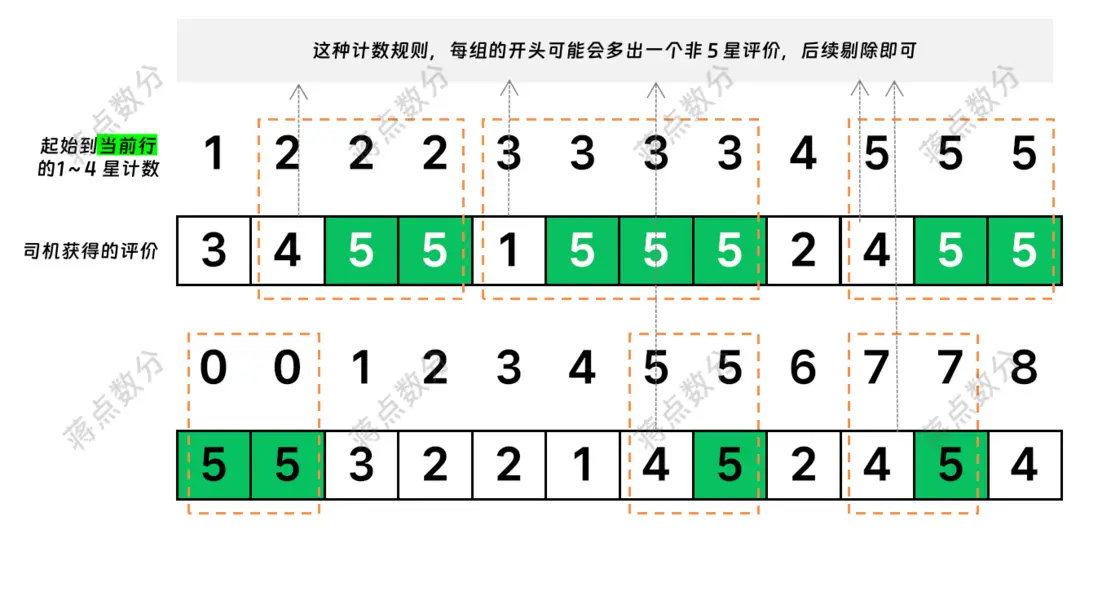
只需要注意剔除每組開頭可能多出來的非 5 星評價,即可完成統計。下面,我用 NumPy 結合一些假設來生成模擬的數據集:
三、生成模擬數據
只關心 SQL 代碼的同學,可以跳轉到第四節(我在工作中使用 Hive 較多,因此採用 Hive 的語法)
為了簡化模擬數據的難度,做如下假設:
1.假設用户下車之後立即評價,評價時間取下車時間
2.司機等待訂單、接客送客加在一起的時間間隔,通過指數分佈模擬
3.訂單的時間間隔,不引入早晚高峯因素,不引入差異化因素 => 對每名司機的參數是一樣的
4.司機回家和睡覺的時間,算在一起,用正態分佈模擬
5.不引入司機吃飯、出車前休息等個人事務的時間,否則模擬起來太複雜
6.對於司機,只限制每日最多在線時長,不做周、月級別的限制
7.假設存在兩類司機:
    a.追求每天達到一個目標收入,達到後則主動收車 => 用單量代替收入
    b.追求每天達到某個在線時長,達到後則主動收車
 8.模擬數據累計後,可能導致的司機日夜規律顛倒 => 違背現實情況,不作調整
模擬代碼如下:
-
定義模擬邏輯需要的
常量:import datetime import numpy as np import pandas as pd # 設置隨機數種子 np.random.seed(2025) # 模擬的司機數量 DRIVER_NUM = 100 # 追求單量的司機數量(不論追求單量還是追求在線時長,都要額外受平台在線時長限制) PURSUING_ORDER_DRIVER_NUM = 55 # 追求訂單的數量取值 (10 ~ 20 單,值太高在其他參數影響下,也取不到) # 離散均勻分佈 pursuing_order_volume = np.random.choice( np.arange(10, 21), size=PURSUING_ORDER_DRIVER_NUM ) # 追求在線時長的司機數量 PURSUING_ONLINE_DRIVER_NUM = DRIVER_NUM - PURSUING_ORDER_DRIVER_NUM # 追求在線時長的取值 (8小時、8.5小時......12小時) pursuing_online_duration = np.random.choice( np.arange(8, 12.5, 0.5), size=PURSUING_ONLINE_DRIVER_NUM ) # 模擬數據的日期範圍 START_DATETIME = datetime.datetime(2025, 1, 1, 8, 0, 0) END_DATETIME = datetime.datetime(2025, 5, 1, 23, 59, 59) # 平均訂單時間間隔(單位秒,包含等單+接客+送客,等於評價時間間隔) ORDER_INTERVAL_AVG = 40 * 60 # 司機平均休息時長(單位秒,包含收車時間) DRIVER_REST_DURATION_AVG = 8 * 3600 # 司機平均休息時長標準差(單位秒) DRIVER_REST_DURATION_STD = 30 * 60 # 每日在線時長上限(秒) ONLINE_DURATION_UPPER_LIMIT = 12 * 3600 -
模擬訂單間隔、乘客評分、休息間隔。為了提高生成速度,儘量一次讓
NumPy生成足夠多的數據;用函數封裝起來,如果超出了預先生成的數據長度,則開啓單次生成:# 為了一次儘可能將數據模擬全 # 根據參數平均值,來計算出大概需要模擬出多少個訂單間隔,再增加 10% 浮動 # round 函數輸出 float 類型,需要轉為 int 類型,不然後續 numpy 的 size 會報錯 ORDER_NUM_NEED_SIMULATION = int( round( (END_DATETIME - START_DATETIME).days * (ONLINE_DURATION_UPPER_LIMIT / ORDER_INTERVAL_AVG) * (1 + 0.1), 0, ) ) # 生成模擬的訂單間隔 order_interval_simulation = np.random.exponential( scale=ORDER_INTERVAL_AVG, size=(DRIVER_NUM, ORDER_NUM_NEED_SIMULATION) ) # 乘客的評價也一併隨機生成 rating_simulation = np.random.choice( np.arange(1, 6), size=(DRIVER_NUM, ORDER_NUM_NEED_SIMULATION), p=[0.01, 0.01, 0.02, 0.06, 0.9], ) def get_order_interval_and_rating_simulation(driver_id, cnt): """ 獲取訂單間隔時長和訂單評分,增加一個函數, 是為了如果批量隨機生成的數據不夠用,再單次生成 """ if cnt >= ORDER_NUM_NEED_SIMULATION: return ( np.random.exponential(scale=ORDER_INTERVAL_AVG), np.random.choice(np.arange(1, 6), p=[0.01, 0.01, 0.02, 0.06, 0.9]), ) else: return ( order_interval_simulation[driver_id][cnt], rating_simulation[driver_id][cnt], ) # 模擬休息的數據( 在線加休息的和有可能小於 24 小時 ) REST_NUM_NEED_SIMULATION = int( round((END_DATETIME - START_DATETIME).days * (1 + 0.1), 0) ) rest_interval_simulation = ( np.clip( np.random.normal(loc=8, scale=0.5, size=(DRIVER_NUM, REST_NUM_NEED_SIMULATION)), a_min=6, a_max=12, ) * 3600 ) def get_rest_interval_simulation(driver_id, cnt): """ 獲取休息間隔時長,增加一個函數,是為了如果批量隨機生成的 數據不夠用,再單次生成 """ if cnt >= REST_NUM_NEED_SIMULATION: return np.clip(np.random.normal(loc=8, scale=0.5), a_min=6, a_max=12) * 3600 else: return rest_interval_simulation[driver_id][cnt] -
根據假設的邏輯,生成司機的全部數據。注意司機休息的判斷條件,以及中間變量清零的處理:
table_data = {"driver_id": [], "rating_time": [], "ratings": []} for driver_id in range(DRIVER_NUM): order_cnt = 0 # 第幾個訂單 rest_cnt = 0 # 第幾次休息 last_time = START_DATETIME # 當前累計在線時間,注意單位是秒 current_online_time = 0 # 當天的訂單,追求訂單的司機需要這個變量 current_order_cnt = 0 while True: table_data["driver_id"].append(driver_id) order_interval, rating = get_order_interval_and_rating_simulation( driver_id, order_cnt ) last_time = last_time + datetime.timedelta(seconds=int(order_interval)) table_data["rating_time"].append(last_time) table_data["ratings"].append(rating) # 當天累計在線時間增加 current_online_time += order_interval # 訂單序號加一 order_cnt += 1 # 當天訂單數量加一 current_order_cnt += 1 # 當天累計時間超過平台限制,需要去休息 rest_flag_1 = current_online_time >= ONLINE_DURATION_UPPER_LIMIT # 前面的司機追求訂單數 rest_flag_2 = ( driver_id < PURSUING_ORDER_DRIVER_NUM and current_order_cnt >= pursuing_order_volume[driver_id] ) # 後面的司機追求在線時長 rest_flag_3 = ( driver_id >= PURSUING_ORDER_DRIVER_NUM and current_online_time >= pursuing_online_duration[driver_id - PURSUING_ORDER_DRIVER_NUM] ) if rest_flag_1 or rest_flag_2 or rest_flag_3: # 增加休息時間 reset_interval = int(get_rest_interval_simulation(driver_id, rest_cnt)) last_time = last_time + datetime.timedelta(seconds=reset_interval) # 當天累計在線時長清零 current_online_time = 0 # 當天累計訂單數清零 current_order_cnt = 0 # 休息次數加一 rest_cnt += 1 # 達到項目總體模擬結束時間,跳出 if last_time > END_DATETIME: break - 將模擬的數據轉為
pd.DataFrame並輸出為csv文件;創建Hive表,並將數據load到表中:
df = pd.DataFrame(table_data)
df["driver_id"] = "driver_" + df["driver_id"].astype("str").str.zfill(2)
df.to_csv(
    "./dwd_uber_simulation_rating_detail.csv",
    sep=",",
    encoding="utf-8-sig",
    index=False,
    header=False,
)

from pyhive import hive

# 配置連接參數
host_ip = "127.0.0.1"
port = 10000
username = "蔣點數分"

with hive.Connection(host=host_ip, port=port) as conn:
    cursor = conn.cursor()

    create_table_sql = """
    CREATE TABLE IF NOT EXISTS data_exercise.dwd_uber_simulation_rating_detail (
        driver_id STRING COMMENT '司機id',
        rating_time TIMESTAMP COMMENT '評價時間',
        ratings TINYINT COMMENT '評分等級,1~5 星'
    )
    COMMENT 'Uber 乘客對司機評分表,模擬數據 | 文章編號 7c98d8ef'
    ROW FORMAT DELIMITED
    FIELDS TERMINATED BY ','
    STORED AS TEXTFILE
    """

    cursor.execute(create_table_sql)

    import os

    load_data_sql = f"""
    LOAD DATA LOCAL INPATH "{os.getcwd() + '/dwd_uber_simulation_rating_detail.csv'}"
    OVERWRITE INTO TABLE data_exercise.dwd_uber_simulation_rating_detail
    """

cursor.execute(load_data_sql)-
將查詢的 SQL,利用
pd.read_sql_query讀取查詢結果。注意此段代碼,仍然位於with上下文中:select_data_sql = ''' with calc_table as ( select driver_id, date_format(rating_time, 'yyyy年ww周') as year_week -- 從週日開始算新的一週 , sum(if(ratings <> 5, 1, 0)) over(partition by driver_id, date_format(rating_time, 'yyyy年ww周') order by rating_time asc) as cnt_tag , ratings from data_exercise.dwd_uber_simulation_rating_detail ) , calc_continuous_five_table as ( select driver_id, year_week, cnt_tag , sum(1) as continuous_five -- sum(if(raings=5,1,0)) , rank() over(partition by year_week order by sum(1) desc) as rk from calc_table where ratings = 5 group by driver_id, year_week, cnt_tag ) select year_week -- 可能有司機並列,使用 collect -- 如果一名司機連續 5 星的次數最高,且出現了兩次,那麼會重複 -- 因此使用 set , collect_set(driver_id) as most_continuous_five_start_drivers from calc_continuous_five_table where rk = 1 group by year_week ''' df_outcome = pd.read_sql_query(select_data_sql, conn) # 在 Jupter 環境下,顯示結果 display(df_outcome)
我通過使用PyHive包實現 Python 操作Hive。我個人電腦部署了Hadoop及Hive,但是沒有開啓認證,企業裏一般常用Kerberos來進行大數據集羣的認證。
四、SQL 解答
我採用 CTE 的寫法來將嵌套邏輯轉為串行,這樣寫對於複雜邏輯的結構梳理具有一定幫助。使用窗口函數 count(if(rating<>5,rating,null)) 或 sum(if(rating<>5,1,0)) 來統計 1~4 星評價的數量。
“每週”因此需要使用 date_format 來提取年份和周 => partition by driver_id, date_format(rating_time, 'yyyy年ww周');使用 order by rating_time asc 時,統計的窗口範圍默認是 rows between preceding unbounded and current row,寫清楚更好。
注意因為統計的邏輯是截至當前行,所以第一個 5 星評價前的那個 1~4 星,它的計數標識跟 5 星是一樣的。所以需要 where 過濾,當然也可以在後續聚合統計時,使用條件處理 sum(if(raings=5,1,0))。
最終結果使用 collect_set 將 driver_id 形成去重數組:一方面可能每個星期有司機連續 5 星好評數並列第一;另一方面極端情況下,連續 5 星好評最多的那個司機如果最多的連續 5 星好評數一週內出現了多次,則這個 driver_id 會出現多次,這是為什麼不用 collect_list 的原因。
with calc_table as (
    select
      driver_id, date_format(rating_time, 'yyyy年ww周') as year_week -- 從週日開始算新的一週
    , sum(if(ratings <> 5, 1, 0)) over(partition by driver_id, date_format(rating_time, 'yyyy年ww周') order by rating_time asc) as cnt_tag
    , ratings
    from data_exercise.dwd_uber_simulation_rating_detail
)

, calc_continuous_five_table as (
    select
      driver_id, year_week, cnt_tag
    , sum(1) as continuous_five -- sum(if(raings=5,1,0))
    , rank() over(partition by year_week order by sum(1) desc) as rk
    from calc_table
    where ratings = 5
    group by driver_id, year_week, cnt_tag
)

select
  year_week
-- 可能有司機並列,使用 collect
-- 如果一名司機連續 5 星的次數最高,且出現了兩次,那麼會重複
-- 因此使用 set
, collect_set(driver_id) as most_continuous_five_start_drivers
, max(continuous_five) as continuous_five
from calc_continuous_five_table
where rk = 1
group by year_week需要注意的是,date_format 的 w 參數是從週日開始算新的一週。我這裏偷懶就不改成按照週一為新的一週來計算。
最簡單的思路是將實際日期往前挪一天,但是週數與跨年問題,往往容易引起混淆,實際使用時需要小心處理。嚴謹起見,應查詢 ISO 8601 的規定。
😁😁😁
我現在正在求職數據類工作(主要是數據分析或數據科學);如果您有合適的機會,懇請您與我聯繫,即時到崗,不限城市。您可以發送私信或通過公眾號聯繫我(全網同名:蔣點數分)。