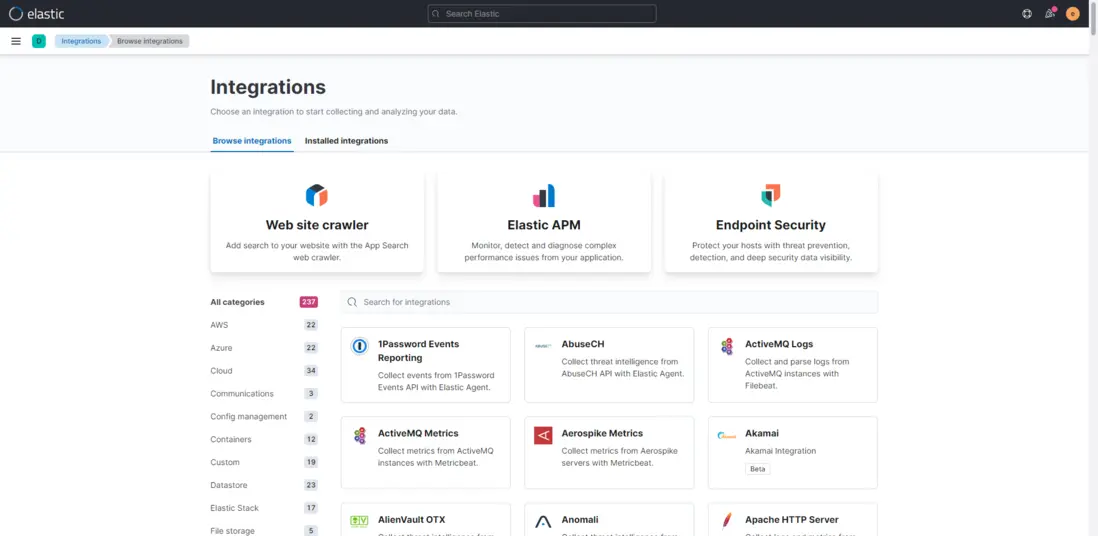
一套好的日誌分析系統可以詳細記錄系統的運行情況,方便我們定位分析系統性能瓶頸、查找定位系統問題。上一篇説明了日誌的多種業務場景以及日誌記錄的實現方式,那麼日誌記錄下來,相關人員就需要對日誌數據進行處理與分析,基於E(ElasticSearch)L(Logstash)K(Kibana)組合的日誌分析系統可以説是目前各家公司普遍的首選方案。
- Elasticsearch: 分佈式、RESTful 風格的搜索和數據分析引擎,可快速存儲、搜索、分析海量的數據。在ELK中用於存儲所有日誌數據。
- Logstash: 開源的數據採集引擎,具有實時管道傳輸功能。Logstash 能夠將來自單獨數據源的數據動態集中到一起,對這些數據加以標準化並傳輸到您所選的地方。在ELK中用於將採集到的日誌數據進行處理、轉換然後存儲到Elasticsearch。
- Kibana: 免費且開放的用户界面,能夠讓您對 Elasticsearch 數據進行可視化,並讓您在 Elastic Stack 中進行導航。您可以進行各種操作,從跟蹤查詢負載,到理解請求如何流經您的整個應用,都能輕鬆完成。在ELK中用於通過界面展示存儲在Elasticsearch中的日誌數據。
作為微服務集羣,必須要考慮當微服務訪問量暴增時的高併發場景,此時系統的日誌數據同樣是爆發式增長,我們需要通過消息隊列做流量削峯處理,Logstash官方提供Redis、Kafka、RabbitMQ等輸入插件。Redis雖然可以用作消息隊列,但其各項功能顯示不如單一實現的消息隊列,所以通常情況下並不使用它的消息隊列功能;Kafka的性能要優於RabbitMQ,通常在日誌採集,數據採集時使用較多,所以這裏我們採用Kafka實現消息隊列功能。
ELK日誌分析系統中,數據傳輸、數據保存、數據展示、流量削峯功能都有了,還少一個組件,就是日誌數據的採集,雖然log4j2可以將日誌數據發送到Kafka,甚至可以將日誌直接輸入到Logstash,但是基於系統設計解耦的考慮,業務系統運行不會影響到日誌分析系統,同時日誌分析系統也不會影響到業務系統,所以,業務只需將日誌記錄下來,然後由日誌分析系統去採集分析即可,Filebeat是ELK日誌系統中常用的日誌採集器,它是 Elastic Stack 的一部分,因此能夠與 Logstash、Elasticsearch 和 Kibana 無縫協作。
- Kafka: 高吞吐量的分佈式發佈訂閲消息隊列,主要應用於大數據的實時處理。
- Filebeat: 輕量型日誌採集器。在 Kubernetes、Docker 或雲端部署中部署 Filebeat,即可獲得所有的日誌流:信息十分完整,包括日誌流的 pod、容器、節點、VM、主機以及自動關聯時用到的其他元數據。此外,Beats Autodiscover 功能可檢測到新容器,並使用恰當的 Filebeat 模塊對這些容器進行自適應監測。
軟件下載:
因經常遇到在內網搭建環境的問題,所以這裏習慣使用下載軟件包的方式進行安裝,雖沒有使用Yum、Docker等安裝方便,但是可以對軟件目錄、配置信息等有更深的瞭解,在後續採用Yum、Docker等方式安裝時,也能清楚安裝了哪些東西,安裝配置的文件是怎樣的,即使出現問題,也可以快速的定位解決。
Elastic Stack全家桶下載主頁: https://www.elastic.co/cn/downloads/
我們選擇如下版本:
- Elasticsearch8.0.0,下載地址:https://artifacts.elastic.co/downloads/elasticsearch/elasticsearch-8.0.0-linux-x86_64.tar.gz
- Logstash8.0.0,下載地址:https://artifacts.elastic.co/downloads/logstash/logstash-8.0.0-linux-x86_64.tar.gz
-
Kibana8.0.0,下載地址:https://artifacts.elastic.co/downloads/kibana/kibana-8.0.0-linux-x86_64.tar.gz
- Filebeat8.0.0,下載地址:https://artifacts.elastic.co/downloads/beats/filebeat/filebeat-8.0.0-linux-x86_64.tar.gz
Kafka下載:
- Kafka3.1.0,下載地址:https://dlcdn.apache.org/kafka/3.1.0/kafka_2.13-3.1.0.tgz
安裝配置:
安裝前先準備好三台CentOS7服務器用於集羣安裝,這是IP地址為:172.16.20.220、172.16.20.221、172.16.20.222,然後將上面下載的軟件包上傳至三台服務器的/usr/local目錄。因服務器資源有限,這裏所有的軟件都安裝在這三台集羣服務器上,在實際生產環境中,請根據業務需求設計規劃進行安裝。
在集羣搭建時,如果能夠編寫shell安裝腳本就會很方便,如果不能編寫,就需要在每台服務器上執行安裝命令,多數ssh客户端提供了多會話同時輸入的功能,這裏一些通用安裝命令可以選擇啓用該功能。
一、安裝Elasticsearch集羣
1、Elasticsearch是使用Java語言開發的,所以需要在環境上安裝jdk並配置環境變量。
- 下載jdk軟件包安裝,https://www.oracle.com/java/technologies/downloads/#java8
新建/usr/local/java目錄
mkdir /usr/local/java將下載的jdk軟件包jdk-8u64-linux-x64.tar.gz上傳到/usr/local/java目錄,然後解壓
tar -zxvf jdk-8u77-linux-x64.tar.gz 配置環境變量/etc/profile
vi /etc/profile在底部添加以下內容
JAVA_HOME=/usr/local/java/jdk1.8.0_64
PATH=$JAVA_HOME/bin:$PATH
CLASSPATH=$JAVA_HOME/jre/lib/ext:$JAVA_HOME/lib/tools.jar
export PATH JAVA_HOME CLASSPATH
使環境變量生效
source /etc/profile-
另外一種十分快捷的方式,如果不是內網環境,可以直接使用命令行安裝,這裏安裝的是免費版本的openjdk
yum install java-1.8.0-openjdk* -y
2、安裝配置Elasticsearch
-
進入/usr/local目錄,解壓Elasticsearch安裝包,請確保執行命令前已將環境準備時的Elasticsearch安裝包上傳至該目錄。
tar -zxvf elasticsearch-8.0.0-linux-x86_64.tar.gz -
重命名文件夾
mv elasticsearch-8.0.0 elasticsearch -
elasticsearch不能使用root用户運行,這裏創建運行elasticsearch的用户組和用户
# 創建用户組 groupadd elasticsearch # 創建用户並添加至用户組 useradd elasticsearch -g elasticsearch # 更改elasticsearch密碼,設置一個自己需要的密碼,這裏設置為和用户名一樣:El12345678 passwd elasticsearch -
新建elasticsearch數據和日誌存放目錄,並給elasticsearch用户賦權限
mkdir -p /data/elasticsearch/data mkdir -p /data/elasticsearch/log chown -R elasticsearch:elasticsearch /data/elasticsearch/* chown -R elasticsearch:elasticsearch /usr/local/elasticsearch/* -
elasticsearch默認啓用了x-pack,集羣通信需要進行安全認證,所以這裏需要用到SSL證書。注意:這裏生成證書的命令只在一台服務器上執行,執行之後copy到另外兩台服務器的相同目錄下。
# 提示輸入密碼時,直接回車 ./elasticsearch-certutil ca -out /usr/local/elasticsearch/config/elastic-stack-ca.p12 # 提示輸入密碼時,直接回車 ./elasticsearch-certutil cert --ca /usr/local/elasticsearch/config/elastic-stack-ca.p12 -out /usr/local/elasticsearch/config/elastic-certificates.p12 -pass "" # 如果使用root用户生成的證書,記得給elasticsearch用户賦權限 chown -R elasticsearch:elasticsearch /usr/local/elasticsearch/config/elastic-certificates.p12 -
設置密碼,這裏在出現輸入密碼時,所有的都是輸入的123456
./elasticsearch-setup-passwords interactive Enter password for [elastic]: Reenter password for [elastic]: Enter password for [apm_system]: Reenter password for [apm_system]: Enter password for [kibana_system]: Reenter password for [kibana_system]: Enter password for [logstash_system]: Reenter password for [logstash_system]: Enter password for [beats_system]: Reenter password for [beats_system]: Enter password for [remote_monitoring_user]: Reenter password for [remote_monitoring_user]: Changed password for user [apm_system] Changed password for user [kibana_system] Changed password for user [kibana] Changed password for user [logstash_system] Changed password for user [beats_system] Changed password for user [remote_monitoring_user] Changed password for user [elastic] -
修改elasticsearch配置文件
vi /usr/local/elasticsearch/config/elasticsearch.yml# 修改配置 # 集羣名稱 cluster.name: log-elasticsearch # 節點名稱 node.name: node-1 # 數據存放路徑 path.data: /data/elasticsearch/data # 日誌存放路徑 path.logs: /data/elasticsearch/log # 當前節點IP network.host: 192.168.60.201 # 對外端口 http.port: 9200 # 集羣ip discovery.seed_hosts: ["172.16.20.220", "172.16.20.221", "172.16.20.222"] # 初始主節點 cluster.initial_master_nodes: ["node-1", "node-2", "node-3"] # 新增配置 # 集羣端口 transport.tcp.port: 9300 transport.tcp.compress: true http.cors.enabled: true http.cors.allow-origin: "*" http.cors.allow-methods: OPTIONS, HEAD, GET, POST, PUT, DELETE http.cors.allow-headers: "X-Requested-With, Content-Type, Content-Length, X-User" xpack.security.enabled: true xpack.security.transport.ssl.enabled: true xpack.security.transport.ssl.verification_mode: certificate xpack.security.transport.ssl.keystore.path: elastic-certificates.p12 xpack.security.transport.ssl.truststore.path: elastic-certificates.p12 -
配置Elasticsearch的JVM參數
vi /usr/local/elasticsearch/config/jvm.options-Xms1g -Xmx1g -
修改Linux默認資源限制數
vi /etc/security/limits.conf - soft nofile 131072
-
hard nofile 131072
vi /etc/sysctl.conf
將值vm.max_map_count值修改為655360
vm.max_map_count=655360
使配置生效
sysctl -p
-
切換用户啓動服務
su elasticsearch cd /usr/local/elasticsearch/bin # 控制枱啓動命令,可以看到具體報錯信息 ./elasticsearch - 訪問我們的服務器地址和端口,可以看到,服務已啓動:
http://172.16.20.220:9200/
http://172.16.20.221:9200/
http://172.16.20.222:9200/
-
正常運行沒有問題後,Ctrl+c關閉服務,然後使用後台啓動命令
./elasticsearch -d備註:後續可通過此命令停止elasticsearch運行
# 查看進程id
ps -ef | grep elastic
# 關閉進程
kill -9 1376(進程id)
3、安裝ElasticSearch界面管理插件elasticsearch-head,只需要在一台服務器上安裝即可,這裏我們安裝到172.16.20.220服務器上
-
配置nodejs環境
下載地址: (https://nodejs.org/dist/v16.14.0/node-v16.14.0-linux-x64.tar.xz)[https://nodejs.org/dist/v16.14.0/node-v16.14.0-linux-x64.tar.xz],將node-v16.14.0-linux-x64.tar.xz上傳到服務器172.16.20.220的/usr/local目錄# 解壓 tar -xvJf node-v16.14.0-linux-x64.tar.xz # 重命名 mv node-v16.14.0-linux-x64 nodejs # 配置環境變量 vi /etc/profile # 新增以下內容 export NODE_HOME=/usr/local/nodejs PATH=$JAVA_HOME/bin:$NODE_HOME/bin:/usr/local/mysql/bin:/usr/local/subversion/bin:$PATH export PATH JAVA_HOME NODE_HOME JENKINS_HOME CLASSPATH # 使配置生效 source /etc/profile # 測試是否配置成功 node -v -
配置elasticsearch-head
項目開源地址:https://github.com/mobz/elasticsearch-head
zip包下載地址:https://github.com/mobz/elasticsearch-head/archive/master.zip
下載後上傳至172.16.20.220的/usr/local目錄,然後進行解壓安裝# 解壓 unzip elasticsearch-head-master.zip # 重命名 mv elasticsearch-head-master elasticsearch-head # 進入到elasticsearch-head目錄 cd elasticsearch-head #切換軟件源,可以提升安裝速度 npm config set registry https://registry.npm.taobao.org # 執行安裝命令 npm install -g npm@8.5.1 npm install phantomjs-prebuilt@2.1.16 --ignore-scripts npm install # 啓動命令 npm run start -
瀏覽器訪問http://172.16.20.220:9100/?auth_user=elastic&auth_password=12... ,需要加上我們上面設置的用户名密碼,就可以看到我們的Elasticsearch集羣狀態了。
二、安裝Kafka集羣
-
環境準備:
新建kafka的日誌目錄和zookeeper數據目錄,因為這兩項默認放在tmp目錄,而tmp目錄中內容會隨重啓而丟失,所以我們自定義以下目錄:
mkdir /data/zookeeper mkdir /data/zookeeper/data mkdir /data/zookeeper/logs mkdir /data/kafka mkdir /data/kafka/data mkdir /data/kafka/logs -
zookeeper.properties配置
vi /usr/local/kafka/config/zookeeper.properties修改如下:
# 修改為自定義的zookeeper數據目錄 dataDir=/data/zookeeper/data # 修改為自定義的zookeeper日誌目錄 dataLogDir=/data/zookeeper/logs # 端口 clientPort=2181 # 註釋掉 #maxClientCnxns=0 # 設置連接參數,添加如下配置 # 為zk的基本時間單元,毫秒 tickTime=2000 # Leader-Follower初始通信時限 tickTime*10 initLimit=10 # Leader-Follower同步通信時限 tickTime*5 syncLimit=5 # 設置broker Id的服務地址,本機ip一定要用0.0.0.0代替 server.1=0.0.0.0:2888:3888 server.2=172.16.20.221:2888:3888 server.3=172.16.20.222:2888:3888 -
在各台服務器的zookeeper數據目錄/data/zookeeper/data添加myid文件,寫入服務broker.id屬性值
在data文件夾中新建myid文件,myid文件的內容為1(一句話創建:echo 1 > myid)
cd /data/zookeeper/data vi myid #添加內容:1 其他兩台主機分別配置 2和3 1 -
kafka配置,進入config目錄下,修改server.properties文件
vi /usr/local/kafka/config/server.properties# 每台服務器的broker.id都不能相同 broker.id=1 # 是否可以刪除topic delete.topic.enable=true # topic 在當前broker上的分片個數,與broker保持一致 num.partitions=3 # 每個主機地址不一樣: listeners=PLAINTEXT://172.16.20.220:9092 advertised.listeners=PLAINTEXT://172.16.20.220:9092 # 具體一些參數 log.dirs=/data/kafka/kafka-logs # 設置zookeeper集羣地址與端口如下: zookeeper.connect=172.16.20.220:2181,172.16.20.221:2181,172.16.20.222:2181 -
Kafka啓動
kafka啓動時先啓動zookeeper,再啓動kafka;關閉時相反,先關閉kafka,再關閉zookeeper。
1、zookeeper啓動命令./zookeeper-server-start.sh ../config/zookeeper.properties &後台運行啓動命令:
nohup ./zookeeper-server-start.sh ../config/zookeeper.properties >/data/zookeeper/logs/zookeeper.log 2>1 &或者
./zookeeper-server-start.sh -daemon ../config/zookeeper.properties &
查看集羣狀態:
./zookeeper-server-start.sh status ../config/zookeeper.properties2、kafka啓動命令
./kafka-server-start.sh ../config/server.properties &後台運行啓動命令:
nohup bin/kafka-server-start.sh ../config/server.properties >/data/kafka/logs/kafka.log 2>1 &或者
./kafka-server-start.sh -daemon ../config/server.properties &3、創建topic,最新版本已經不需要使用zookeeper參數創建。
./kafka-topics.sh --create --replication-factor 2 --partitions 1 --topic test --bootstrap-server 172.16.20.220:9092參數解釋:
複製兩份
--replication-factor 2
創建1個分區
--partitions 1
topic 名稱
--topic test
4、查看已經存在的topic(三台設備都執行時可以看到)
./kafka-topics.sh --list --bootstrap-server 172.16.20.220:90925、啓動生產者:
./kafka-console-producer.sh --broker-list 172.16.20.220:9092 --topic test6、啓動消費者:
./kafka-console-consumer.sh --bootstrap-server 172.16.20.221:9092 --topic test
./kafka-console-consumer.sh --bootstrap-server 172.16.20.222:9092 --topic test
添加參數 --from-beginning 從開始位置消費,不是從最新消息
./kafka-console-consumer.sh --bootstrap-server 172.16.20.221 --topic test --from-beginning7、測試:在生產者輸入test,可以在消費者的兩台服務器上看到同樣的字符test,説明Kafka服務器集羣已搭建成功。
三、安裝配置Logstash
Logstash沒有提供集羣安裝方式,相互之間並沒有交互,但是我們可以配置同屬一個Kafka消費者組,來實現統一消息只消費一次的功能。
-
解壓安裝包
tar -zxvf logstash-8.0.0-linux-x86_64.tar.gz mv logstash-8.0.0 logstash - 配置kafka主題和組
cd logstash
# 新建配置文件
vi logstash-kafka.conf
# 新增以下內容
input {
  kafka {
    codec => "json"
    group_id => "logstash"
    client_id => "logstash-api"
    topics_pattern => "api_log"
    type => "api"
    bootstrap_servers => "172.16.20.220:9092,172.16.20.221:9092,172.16.20.222:9092"
    auto_offset_reset => "latest"
  }
  kafka {
    codec => "json"
    group_id => "logstash"
    client_id => "logstash-operation"
    topics_pattern => "operation_log"
    type => "operation"
    bootstrap_servers => "172.16.20.220:9092,172.16.20.221:9092,172.16.20.222:9092"
    auto_offset_reset => "latest"
  }
  kafka {
    codec => "json"
    group_id => "logstash"
    client_id => "logstash-debugger"
    topics_pattern => "debugger_log"
    type => "debugger"
    bootstrap_servers => "172.16.20.220:9092,172.16.20.221:9092,172.16.20.222:9092"
    auto_offset_reset => "latest"
  }
  kafka {
    codec => "json"
    group_id => "logstash"
    client_id => "logstash-nginx"
    topics_pattern => "nginx_log"
    type => "nginx"
    bootstrap_servers => "172.16.20.220:9092,172.16.20.221:9092,172.16.20.222:9092"
    auto_offset_reset => "latest"
  }
}
output {
 if [type] == "api"{
  elasticsearch {
    hosts => ["172.16.20.220:9200","172.16.20.221:9200","172.16.20.222:9200"]
    index => "logstash_api-%{+YYYY.MM.dd}"
    user => "elastic"
    password => "123456"
  }
 }
 if [type] == "operation"{
  elasticsearch {
    hosts => ["172.16.20.220:9200","172.16.20.221:9200","172.16.20.222:9200"]
    index => "logstash_operation-%{+YYYY.MM.dd}"
    user => "elastic"
    password => "123456"
  }
 }
 if [type] == "debugger"{
  elasticsearch {
    hosts => ["172.16.20.220:9200","172.16.20.221:9200","172.16.20.222:9200"]
    index => "logstash_operation-%{+YYYY.MM.dd}"
    user => "elastic"
    password => "123456"
  }
 }
 if [type] == "nginx"{
  elasticsearch {
    hosts => ["172.16.20.220:9200","172.16.20.221:9200","172.16.20.222:9200"]
    index => "logstash_operation-%{+YYYY.MM.dd}"
    user => "elastic"
    password => "123456"
  }
 }
}-
啓動logstash
# 切換到bin目錄
cd /usr/local/logstash/bin
# 啓動命令
nohup ./logstash -f ../config/logstash-kafka.conf &
#查看啓動日誌
tail -f nohup.out
四、安裝配置Kibana
-
解壓安裝文件
tar -zxvf kibana-8.0.0-linux-x86_64.tar.gz mv kibana-8.0.0 kibana -
修改配置文件
cd /usr/local/kibana/config vi kibana.yml # 修改以下內容 server.port: 5601 server.host: "172.16.20.220" elasticsearch.hosts: ["http://172.16.20.220:9200","http://172.16.20.221:9200","http://172.16.20.222:9200"] elasticsearch.username: "kibana_system" elasticsearch.password: "123456" -
啓動服務
cd /usr/local/kibana/bin # 默認不允許使用root運行,可以添加 --allow-root 參數使用root用户運行,也可以跟Elasticsearch一樣新增一個用户組用户 nohup ./kibana --allow-root & - 訪問http://172.16.20.220:5601/,並使用elastic / 123456登錄。
五、安裝Filebeat
Filebeat用於安裝在業務軟件運行服務器,收集業務產生的日誌,並推送到我們配置的Kafka、Redis、RabbitMQ等消息中間件,或者直接保存到Elasticsearch,下面來講解如何安裝配置:
1、進入到/usr/local目錄,執行解壓命令
tar -zxvf filebeat-8.0.0-linux-x86_64.tar.gz

mv filebeat-8.0.0-linux-x86_64 filebeat
2、編輯配置filebeat.yml
配置文件中默認是輸出到elasticsearch,這裏我們改為kafka,同文件目錄下的filebeat.reference.yml文件是所有配置的實例,可以直接將kafka的配置複製到filebeat.yml
-
配置採集開關和採集路徑:
-
type: filestream
Change to true to enable this input configuration.
enable改為true
enabled: true
Paths that should be crawled and fetched. Glob based paths.
修改微服務日誌的實際路徑
paths:
- /data/gitegg/log/gitegg-service-system/*.log
- /data/gitegg/log/gitegg-service-base/*.log
- /data/gitegg/log/gitegg-service-oauth/*.log
- /data/gitegg/log/gitegg-service-gateway/*.log
- /data/gitegg/log/gitegg-service-extension/*.log
- /data/gitegg/log/gitegg-service-bigdata/*.log
#- c:\programdata\elasticsearch\logs*
Exclude lines. A list of regular expressions to match. It drops the lines that are
matching any regular expression from the list.
exclude_lines: ['^DBG']
Include lines. A list of regular expressions to match. It exports the lines that are
matching any regular expression from the list.
include_lines: ['^ERR', '^WARN']
Exclude files. A list of regular expressions to match. Filebeat drops the files that
are matching any regular expression from the list. By default, no files are dropped.
prospector.scanner.exclude_files: ['.gz$']
Optional additional fields. These fields can be freely picked
to add additional information to the crawled log files for filtering
fields:
level: debug
review: 1
-
Elasticsearch 模板配置
# ======================= Elasticsearch template setting ======================= setup.template.settings: index.number_of_shards: 3 index.number_of_replicas: 1 #index.codec: best_compression #_source.enabled: false # 允許自動生成index模板 setup.template.enabled: true # # 生成index模板時字段配置文件 setup.template.fields: fields.yml # # 如果存在模塊則覆蓋 setup.template.overwrite: true # # 生成index模板的名稱 setup.template.name: "api_log" # # 生成index模板匹配的index格式 setup.template.pattern: "api-*" #索引生命週期管理ilm功能默認開啓,開啓的情況下索引名稱只能為filebeat-*, 通過setup.ilm.enabled: false進行關閉; setup.ilm.pattern: "{now/d}" setup.ilm.enabled: false -
開啓儀表盤並配置使用Kibana儀表盤:
# ================================= Dashboards ================================= # These settings control loading the sample dashboards to the Kibana index. Loading # the dashboards is disabled by default and can be enabled either by setting the # options here or by using the `setup` command. setup.dashboards.enabled: true # The URL from where to download the dashboards archive. By default this URL # has a value which is computed based on the Beat name and version. For released # versions, this URL points to the dashboard archive on the artifacts.elastic.co # website. #setup.dashboards.url: # =================================== Kibana =================================== # Starting with Beats version 6.0.0, the dashboards are loaded via the Kibana API. # This requires a Kibana endpoint configuration. setup.kibana: # Kibana Host # Scheme and port can be left out and will be set to the default (http and 5601) # In case you specify and additional path, the scheme is required: http://localhost:5601/path # IPv6 addresses should always be defined as: https://[2001:db8::1]:5601 host: "172.16.20.220:5601" # Kibana Space ID # ID of the Kibana Space into which the dashboards should be loaded. By default, # the Default Space will be used. #space.id: -
配置輸出到Kafka,完整的filebeat.yml如下
###################### Filebeat Configuration Example ######################### # This file is an example configuration file highlighting only the most common # options. The filebeat.reference.yml file from the same directory contains all the # supported options with more comments. You can use it as a reference. # # You can find the full configuration reference here: # https://www.elastic.co/guide/en/beats/filebeat/index.html # For more available modules and options, please see the filebeat.reference.yml sample # configuration file. # ============================== Filebeat inputs =============================== filebeat.inputs: # Each - is an input. Most options can be set at the input level, so # you can use different inputs for various configurations. # Below are the input specific configurations. -
type: filestream
Change to true to enable this input configuration.
enabled: true
Paths that should be crawled and fetched. Glob based paths.
paths:
- /data/gitegg/log//operation.log
#- c:\programdata\elasticsearch\logs*
Exclude lines. A list of regular expressions to match. It drops the lines that are
matching any regular expression from the list.
exclude_lines: ['^DBG']
Include lines. A list of regular expressions to match. It exports the lines that are
matching any regular expression from the list.
include_lines: ['^ERR', '^WARN']
Exclude files. A list of regular expressions to match. Filebeat drops the files that
are matching any regular expression from the list. By default, no files are dropped.
prospector.scanner.exclude_files: ['.gz$']
Optional additional fields. These fields can be freely picked
to add additional information to the crawled log files for filtering
fields:
topic: operation_loglevel: debug
review: 1
filestream is an input for collecting log messages from files.
- /data/gitegg/log//operation.log
-
type: filestream
Change to true to enable this input configuration.
enabled: true
Paths that should be crawled and fetched. Glob based paths.
paths:
- /data/gitegg/log//api.log
#- c:\programdata\elasticsearch\logs*
Exclude lines. A list of regular expressions to match. It drops the lines that are
matching any regular expression from the list.
exclude_lines: ['^DBG']
Include lines. A list of regular expressions to match. It exports the lines that are
matching any regular expression from the list.
include_lines: ['^ERR', '^WARN']
Exclude files. A list of regular expressions to match. Filebeat drops the files that
are matching any regular expression from the list. By default, no files are dropped.
prospector.scanner.exclude_files: ['.gz$']
Optional additional fields. These fields can be freely picked
to add additional information to the crawled log files for filtering
fields:
topic: api_loglevel: debug
review: 1
filestream is an input for collecting log messages from files.
- /data/gitegg/log//api.log
-
type: filestream
Change to true to enable this input configuration.
enabled: true
Paths that should be crawled and fetched. Glob based paths.
paths:
- /data/gitegg/log//debug.log
#- c:\programdata\elasticsearch\logs*
Exclude lines. A list of regular expressions to match. It drops the lines that are
matching any regular expression from the list.
exclude_lines: ['^DBG']
Include lines. A list of regular expressions to match. It exports the lines that are
matching any regular expression from the list.
include_lines: ['^ERR', '^WARN']
Exclude files. A list of regular expressions to match. Filebeat drops the files that
are matching any regular expression from the list. By default, no files are dropped.
prospector.scanner.exclude_files: ['.gz$']
Optional additional fields. These fields can be freely picked
to add additional information to the crawled log files for filtering
fields:
topic: debugger_loglevel: debug
review: 1
filestream is an input for collecting log messages from files.
- /data/gitegg/log//debug.log
-
type: filestream
Change to true to enable this input configuration.
enabled: true
Paths that should be crawled and fetched. Glob based paths.
paths:
- /usr/local/nginx/logs/access.log
#- c:\programdata\elasticsearch\logs*
Exclude lines. A list of regular expressions to match. It drops the lines that are
matching any regular expression from the list.
exclude_lines: ['^DBG']
Include lines. A list of regular expressions to match. It exports the lines that are
matching any regular expression from the list.
include_lines: ['^ERR', '^WARN']
Exclude files. A list of regular expressions to match. Filebeat drops the files that
are matching any regular expression from the list. By default, no files are dropped.
prospector.scanner.exclude_files: ['.gz$']
Optional additional fields. These fields can be freely picked
to add additional information to the crawled log files for filtering
fields:
topic: nginx_loglevel: debug
review: 1
============================== Filebeat modules ==============================
filebeat.config.modules:
Glob pattern for configuration loading
path: ${path.config}/modules.d/*.yml
Set to true to enable config reloading
reload.enabled: false
Period on which files under path should be checked for changes
reload.period: 10s
======================= Elasticsearch template setting =======================
setup.template.settings:
index.number_of_shards: 3
index.number_of_replicas: 1index.codec: best_compression
_source.enabled: false
允許自動生成index模板
setup.template.enabled: true
生成index模板時字段配置文件
setup.template.fields: fields.yml
如果存在模塊則覆蓋
setup.template.overwrite: true
生成index模板的名稱
setup.template.name: "gitegg_log"
生成index模板匹配的index格式
setup.template.pattern: "filebeat-*"
索引生命週期管理ilm功能默認開啓,開啓的情況下索引名稱只能為filebeat-*, 通過setup.ilm.enabled: false進行關閉;
setup.ilm.pattern: "{now/d}"
setup.ilm.enabled: false================================== General ===================================
The name of the shipper that publishes the network data. It can be used to group
all the transactions sent by a single shipper in the web interface.
name:
The tags of the shipper are included in their own field with each
transaction published.
tags: ["service-X", "web-tier"]
Optional fields that you can specify to add additional information to the
output.
fields:
env: staging
================================= Dashboards =================================
These settings control loading the sample dashboards to the Kibana index. Loading
the dashboards is disabled by default and can be enabled either by setting the
options here or by using the
setupcommand.setup.dashboards.enabled: true
The URL from where to download the dashboards archive. By default this URL
has a value which is computed based on the Beat name and version. For released
versions, this URL points to the dashboard archive on the artifacts.elastic.co
website.
setup.dashboards.url:
=================================== Kibana ===================================
Starting with Beats version 6.0.0, the dashboards are loaded via the Kibana API.
This requires a Kibana endpoint configuration.
setup.kibana:
Kibana Host
Scheme and port can be left out and will be set to the default (http and 5601)
In case you specify and additional path, the scheme is required: http://localhost:5601/path
IPv6 addresses should always be defined as: https://[2001:db8::1]:5601
host: "172.16.20.220:5601"
Optional protocol and basic auth credentials.
protocol: "https"
username: "elastic"
password: "123456"Optional HTTP path
path: ""
Optional Kibana space ID.
space.id: ""
Custom HTTP headers to add to each request
headers:
X-My-Header: Contents of the header
Use SSL settings for HTTPS.
ssl.enabled: true
=============================== Elastic Cloud ================================
These settings simplify using Filebeat with the Elastic Cloud (https://cloud.elastic.co/).
The cloud.id setting overwrites the
output.elasticsearch.hostsandsetup.kibana.hostoptions.You can find the
cloud.idin the Elastic Cloud web UI.cloud.id:
The cloud.auth setting overwrites the
output.elasticsearch.usernameandoutput.elasticsearch.passwordsettings. The format is<user>:<pass>.cloud.auth:
================================== Outputs ===================================
Configure what output to use when sending the data collected by the beat.
---------------------------- Elasticsearch Output ----------------------------
output.elasticsearch:
Array of hosts to connect to.
hosts: ["localhost:9200"]
Protocol - either
http(default) orhttps.protocol: "https"
Authentication credentials - either API key or username/password.
api_key: "id:api_key"
username: "elastic"
password: "changeme"
------------------------------ Logstash Output -------------------------------
output.logstash:
The Logstash hosts
hosts: ["localhost:5044"]
Optional SSL. By default is off.
List of root certificates for HTTPS server verifications
ssl.certificate_authorities: ["/etc/pki/root/ca.pem"]
Certificate for SSL client authentication
ssl.certificate: "/etc/pki/client/cert.pem"
Client Certificate Key
ssl.key: "/etc/pki/client/cert.key"
-------------------------------- Kafka Output --------------------------------
output.kafka:
Boolean flag to enable or disable the output module.
enabled: true
The list of Kafka broker addresses from which to fetch the cluster metadata.
The cluster metadata contain the actual Kafka brokers events are published
to.
hosts: ["172.16.20.220:9092","172.16.20.221:9092","172.16.20.222:9092"]
The Kafka topic used for produced events. The setting can be a format string
using any event field. To set the topic from document type use
%{[type]}.topic: '%{[fields.topic]}'
The Kafka event key setting. Use format string to create a unique event key.
By default no event key will be generated.
key: ''
The Kafka event partitioning strategy. Default hashing strategy is
hashusing the
output.kafka.keysetting or randomly distributes events ifoutput.kafka.keyis not configured.partition.hash:
# If enabled, events will only be published to partitions with reachable
# leaders. Default is false.
reachable_only: true# Configure alternative event field names used to compute the hash value.
# If emptyoutput.kafka.keysetting will be used.
# Default value is empty list.
#hash: []Authentication details. Password is required if username is set.
username: ''
password: ''
SASL authentication mechanism used. Can be one of PLAIN, SCRAM-SHA-256 or SCRAM-SHA-512.
Defaults to PLAIN when
usernameandpasswordare configured.sasl.mechanism: ''
Kafka version Filebeat is assumed to run against. Defaults to the "1.0.0".
version: '1.0.0'
Configure JSON encoding
codec.json:
# Pretty-print JSON event
#pretty: false# Configure escaping HTML symbols in strings.
#escape_html: falseMetadata update configuration. Metadata contains leader information
used to decide which broker to use when publishing.
metadata:
# Max metadata request retry attempts when cluster is in middle of leader
# election. Defaults to 3 retries.
#retry.max: 3# Wait time between retries during leader elections. Default is 250ms.
#retry.backoff: 250ms# Refresh metadata interval. Defaults to every 10 minutes.
#refresh_frequency: 10m# Strategy for fetching the topics metadata from the broker. Default is false.
#full: falseThe number of concurrent load-balanced Kafka output workers.
worker: 1
The number of times to retry publishing an event after a publishing failure.
After the specified number of retries, events are typically dropped.
Some Beats, such as Filebeat, ignore the max_retries setting and retry until
all events are published. Set max_retries to a value less than 0 to retry
until all events are published. The default is 3.
max_retries: 3
The number of seconds to wait before trying to republish to Kafka
after a network error. After waiting backoff.init seconds, the Beat
tries to republish. If the attempt fails, the backoff timer is increased
exponentially up to backoff.max. After a successful publish, the backoff
timer is reset. The default is 1s.
backoff.init: 1s
The maximum number of seconds to wait before attempting to republish to
Kafka after a network error. The default is 60s.
backoff.max: 60s
The maximum number of events to bulk in a single Kafka request. The default
is 2048.
bulk_max_size: 2048
Duration to wait before sending bulk Kafka request. 0 is no delay. The default
is 0.
bulk_flush_frequency: 0s
The number of seconds to wait for responses from the Kafka brokers before
timing out. The default is 30s.
timeout: 30s
The maximum duration a broker will wait for number of required ACKs. The
default is 10s.
broker_timeout: 10s
The number of messages buffered for each Kafka broker. The default is 256.
channel_buffer_size: 256
The keep-alive period for an active network connection. If 0s, keep-alives
are disabled. The default is 0 seconds.
keep_alive: 0
Sets the output compression codec. Must be one of none, snappy and gzip. The
default is gzip.
compression: gzip
Set the compression level. Currently only gzip provides a compression level
between 0 and 9. The default value is chosen by the compression algorithm.
compression_level: 4
The maximum permitted size of JSON-encoded messages. Bigger messages will be
dropped. The default value is 1000000 (bytes). This value should be equal to
or less than the broker's message.max.bytes.
max_message_bytes: 1000000
The ACK reliability level required from broker. 0=no response, 1=wait for
local commit, -1=wait for all replicas to commit. The default is 1. Note:
If set to 0, no ACKs are returned by Kafka. Messages might be lost silently
on error.
required_acks: 1
The configurable ClientID used for logging, debugging, and auditing
purposes. The default is "beats".
client_id: beats
Use SSL settings for HTTPS.
ssl.enabled: true
Controls the verification of certificates. Valid values are:
* full, which verifies that the provided certificate is signed by a trusted
authority (CA) and also verifies that the server's hostname (or IP address)
matches the names identified within the certificate.
* strict, which verifies that the provided certificate is signed by a trusted
authority (CA) and also verifies that the server's hostname (or IP address)
matches the names identified within the certificate. If the Subject Alternative
Name is empty, it returns an error.
* certificate, which verifies that the provided certificate is signed by a
trusted authority (CA), but does not perform any hostname verification.
* none, which performs no verification of the server's certificate. This
mode disables many of the security benefits of SSL/TLS and should only be used
after very careful consideration. It is primarily intended as a temporary
diagnostic mechanism when attempting to resolve TLS errors; its use in
production environments is strongly discouraged.
The default value is full.
ssl.verification_mode: full
List of supported/valid TLS versions. By default all TLS versions from 1.1
up to 1.3 are enabled.
ssl.supported_protocols: [TLSv1.1, TLSv1.2, TLSv1.3]
List of root certificates for HTTPS server verifications
ssl.certificate_authorities: ["/etc/pki/root/ca.pem"]
Certificate for SSL client authentication
ssl.certificate: "/etc/pki/client/cert.pem"
Client certificate key
ssl.key: "/etc/pki/client/cert.key"
Optional passphrase for decrypting the certificate key.
ssl.key_passphrase: ''
Configure cipher suites to be used for SSL connections
ssl.cipher_suites: []
Configure curve types for ECDHE-based cipher suites
ssl.curve_types: []
Configure what types of renegotiation are supported. Valid options are
never, once, and freely. Default is never.
ssl.renegotiation: never
Configure a pin that can be used to do extra validation of the verified certificate chain,
this allow you to ensure that a specific certificate is used to validate the chain of trust.
The pin is a base64 encoded string of the SHA-256 fingerprint.
ssl.ca_sha256: ""
A root CA HEX encoded fingerprint. During the SSL handshake if the
fingerprint matches the root CA certificate, it will be added to
the provided list of root CAs (
certificate_authorities), if thelist is empty or not defined, the matching certificate will be the
only one in the list. Then the normal SSL validation happens.
ssl.ca_trusted_fingerprint: ""
Enable Kerberos support. Kerberos is automatically enabled if any Kerberos setting is set.
kerberos.enabled: true
Authentication type to use with Kerberos. Available options: keytab, password.
kerberos.auth_type: password
Path to the keytab file. It is used when auth_type is set to keytab.
kerberos.keytab: /etc/security/keytabs/kafka.keytab
Path to the Kerberos configuration.
kerberos.config_path: /etc/krb5.conf
The service name. Service principal name is contructed from
service_name/hostname@realm.
kerberos.service_name: kafka
Name of the Kerberos user.
kerberos.username: elastic
Password of the Kerberos user. It is used when auth_type is set to password.
kerberos.password: changeme
Kerberos realm.
kerberos.realm: ELASTIC
Enables Kerberos FAST authentication. This may
conflict with certain Active Directory configurations.
kerberos.enable_krb5_fast: false
================================= Processors =================================
processors:
- add_host_metadata:
when.not.contains.tags: forwarded - add_cloud_metadata: ~
- add_docker_metadata: ~
- add_kubernetes_metadata: ~
================================== Logging ===================================
Sets log level. The default log level is info.
Available log levels are: error, warning, info, debug
logging.level: debug
At debug level, you can selectively enable logging only for some components.
To enable all selectors use ["*"]. Examples of other selectors are "beat",
"publisher", "service".
logging.selectors: ["*"]
============================= X-Pack Monitoring ==============================
Filebeat can export internal metrics to a central Elasticsearch monitoring
cluster. This requires xpack monitoring to be enabled in Elasticsearch. The
reporting is disabled by default.
Set to true to enable the monitoring reporter.
monitoring.enabled: false
Sets the UUID of the Elasticsearch cluster under which monitoring data for this
Filebeat instance will appear in the Stack Monitoring UI. If output.elasticsearch
is enabled, the UUID is derived from the Elasticsearch cluster referenced by output.elasticsearch.
monitoring.cluster_uuid:
Uncomment to send the metrics to Elasticsearch. Most settings from the
Elasticsearch output are accepted here as well.
Note that the settings should point to your Elasticsearch monitoring cluster.
Any setting that is not set is automatically inherited from the Elasticsearch
output configuration, so if you have the Elasticsearch output configured such
that it is pointing to your Elasticsearch monitoring cluster, you can simply
uncomment the following line.
monitoring.elasticsearch:
============================== Instrumentation ===============================
Instrumentation support for the filebeat.
instrumentation:
# Set to true to enable instrumentation of filebeat.
#enabled: false# Environment in which filebeat is running on (eg: staging, production, etc.)
#environment: ""# APM Server hosts to report instrumentation results to.
#hosts:
# - http://localhost:8200# API Key for the APM Server(s).
# If api_key is set then secret_token will be ignored.
#api_key:# Secret token for the APM Server(s).
#secret_token:================================= Migration ==================================
This allows to enable 6.7 migration aliases
migration.6_to_7.enabled: true
- /usr/local/nginx/logs/access.log
-
執行filebeat啓動命令
./filebeat -e -c filebeat.yml後台啓動命令
nohup ./filebeat -e -c filebeat.yml >/dev/null 2>&1 &停止命令
ps -ef |grep filebeat
kill -9 進程號
六、測試配置是否正確
1、測試filebeat是否能夠採集log文件併發送到Kafka
-
在kafka服務器開啓消費者,監聽api_log主題和operation_log主題
./kafka-console-consumer.sh --bootstrap-server 172.16.20.221:9092 --topic api_log ./kafka-console-consumer.sh --bootstrap-server 172.16.20.222:9092 --topic operation_log -
手動寫入日誌文件,按照filebeat配置的採集目錄寫入
echo "api log1111" > /data/gitegg/log/gitegg-service-system/api.log echo "operation log1111" > /data/gitegg/log/gitegg-service-system/operation.log - 觀察消費者是消費到日誌推送內容

2、測試logstash是消費Kafka的日誌主題,並將日誌內容存入Elasticsearch
-
手動寫入日誌文件
echo "api log8888888888888888888888" > /data/gitegg/log/gitegg-service-system/api.log echo "operation loggggggggggggggggggg" > /data/gitegg/log/gitegg-service-system/operation.log - 打開Elasticsearch Head界面 http://172.16.20.220:9100/?auth_user=elastic&auth_password=12... ,查詢Elasticsearch是否有數據。
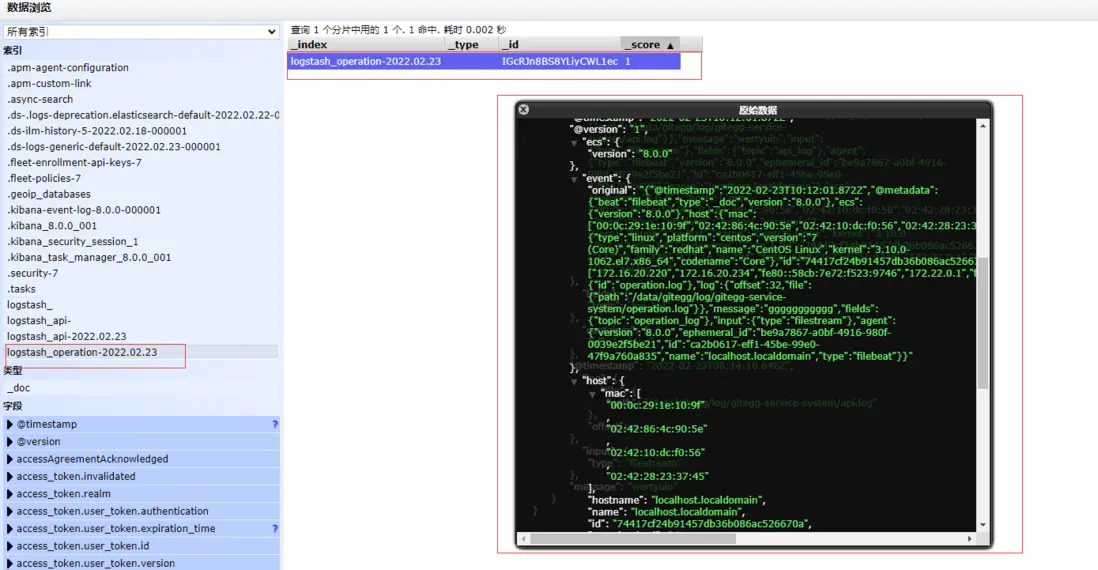
自動新增的兩個index,規則是logstash中配置的
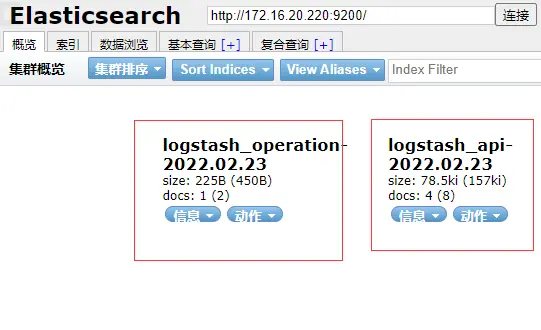
數據瀏覽頁可以看到Elasticsearch中存儲的日誌數據內容,説明我們的配置已經生效。
七、配置Kibana用於日誌統計和展示
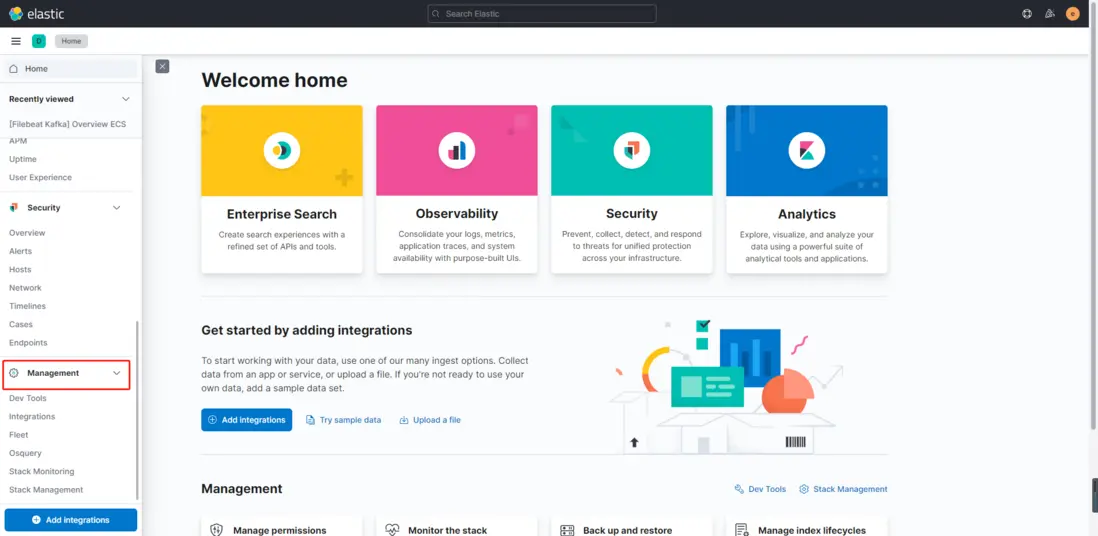
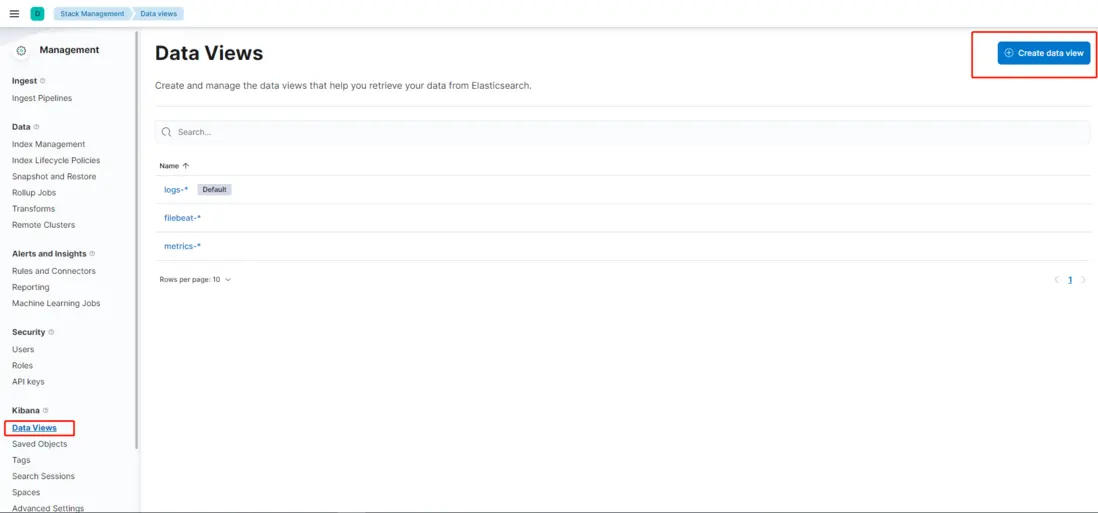
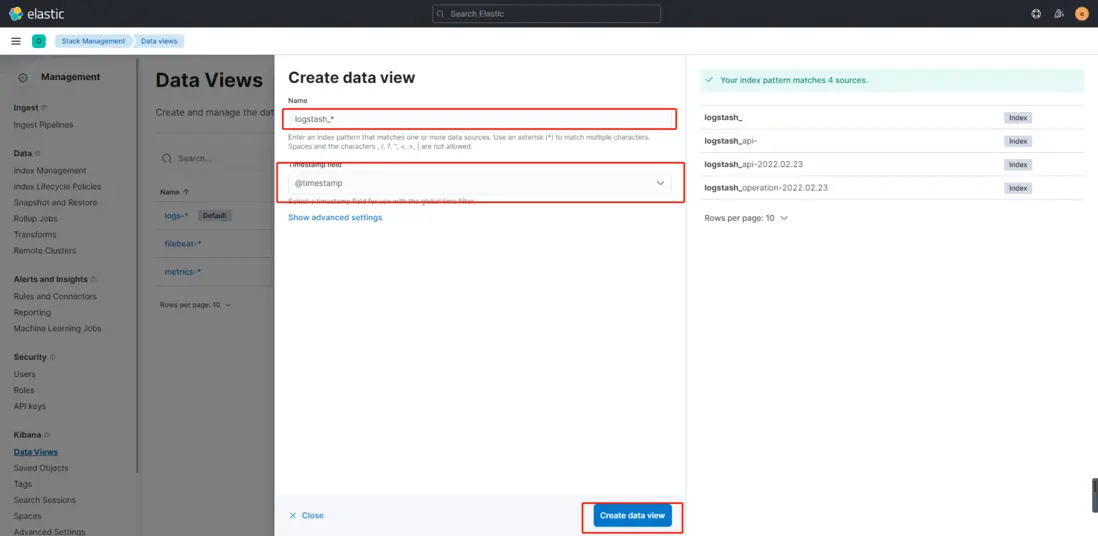
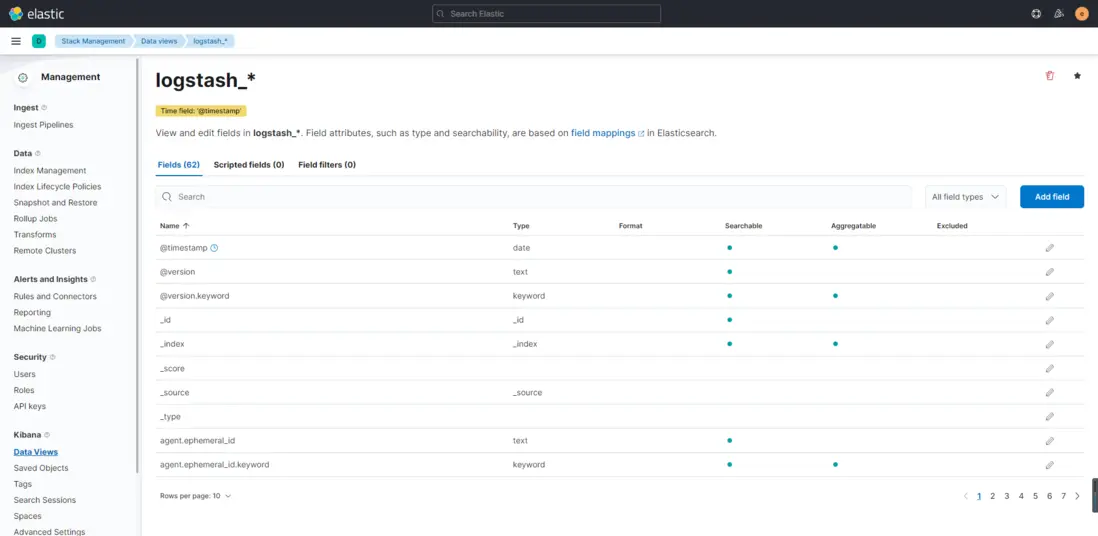
- 依次點擊左側菜單Management -> Kibana -> Data Views -> Create data view , 輸入logstash_* ,選擇@timestamp,再點擊Create data view按鈕,完成創建。
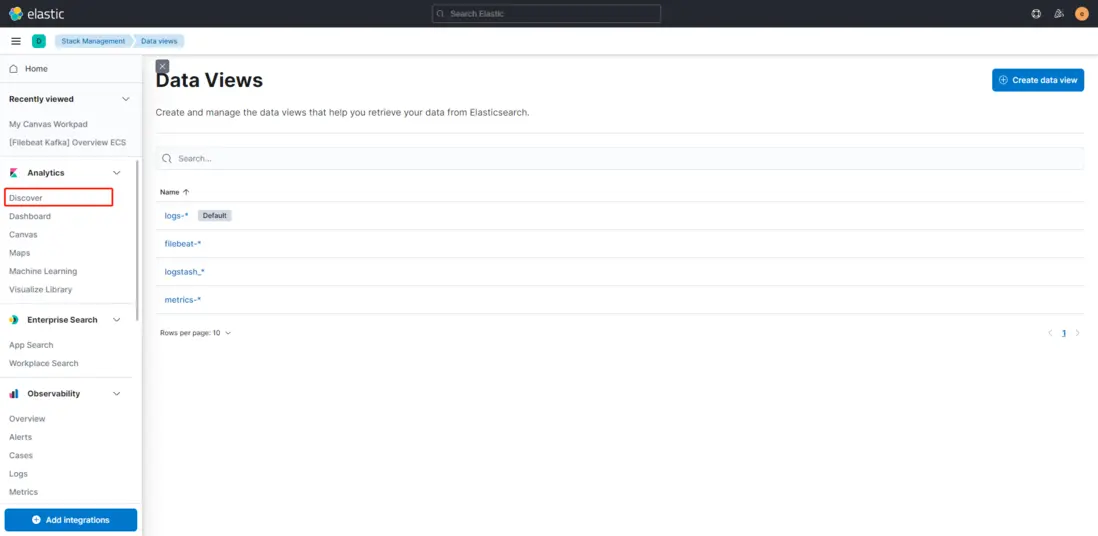
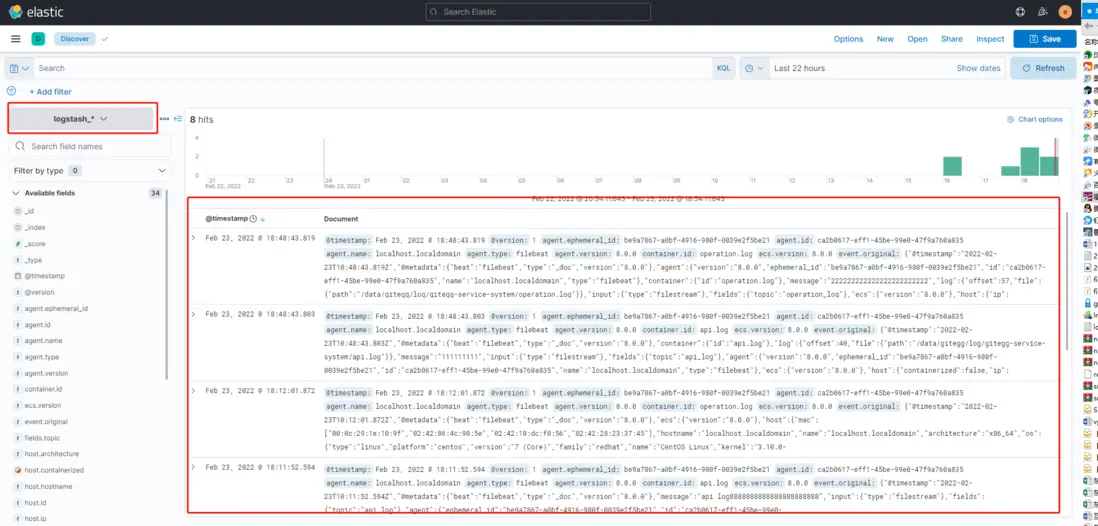
- 點擊日誌分析查詢菜單Analytics -> Discover,選擇logstash_* 進行日誌查詢
GitEgg-Cloud是一款基於SpringCloud整合搭建的企業級微服務應用開發框架,開源項目地址:
Gitee: https://gitee.com/wmz1930/GitEgg
GitHub: https://github.com/wmz1930/GitEgg


