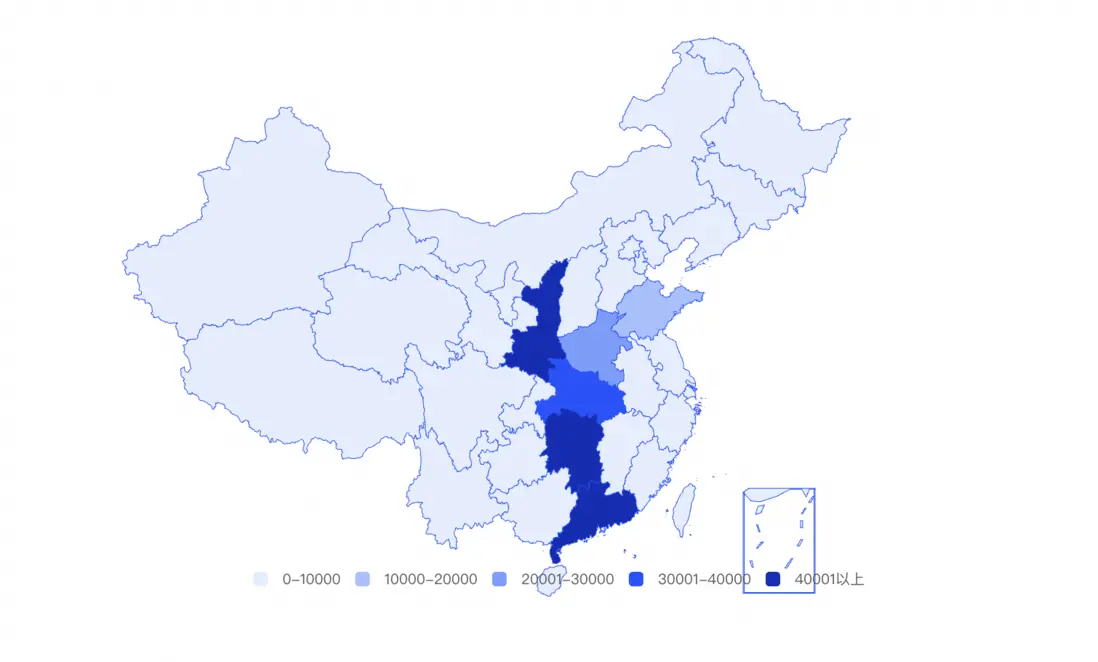
在做中國地圖的時候,遇到幾個問題
第一個:南海諸島和海南省中的小島去掉
去掉後的效果:
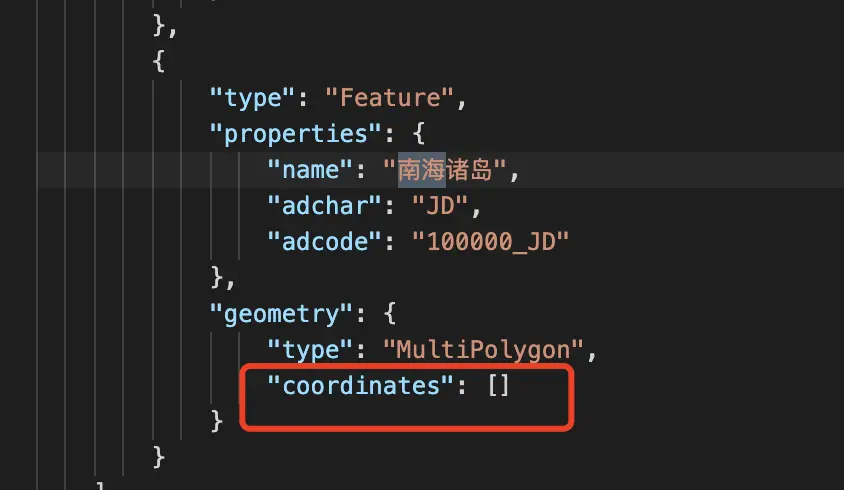
首先:找到中國地圖china.json,把最後一個南海諸島的經緯度刪掉,
"geometry": {
                "type": "MultiPolygon",
                "coordinates": []
            }
刪掉後是這樣的,如圖
然後就是最難的海南省,這個不能把json文件中geometry中的coordinates全部刪掉,要保留着部分,如下:
"geometry": {
"type": "MultiPolygon",
"coordinates": [
[
[
[
110.106396,
20.026812
],
[
110.042339,
19.991384
],
[
109.997375,
19.980136
],
[
109.965346,
19.993634
],
[
109.898825,
19.994196
],
[
109.855093,
19.984073
],
[
109.814441,
19.993072
],
[
109.76147,
19.981261
],
[
109.712195,
20.017253
],
[
109.657993,
20.01163
],
[
109.585312,
19.98801
],
[
109.526797,
19.943573
],
[
109.498464,
19.873236
],
[
109.411001,
19.895184
],
[
109.349407,
19.898561
],
[
109.300748,
19.917693
],
[
109.25948,
19.898561
],
[
109.255784,
19.867045
],
[
109.231147,
19.863105
],
[
109.159082,
19.79048
],
[
109.169553,
19.736411
],
[
109.147379,
19.704863
],
[
109.093792,
19.68965
],
[
109.048829,
19.619764
],
[
108.993394,
19.587065
],
[
108.92872,
19.524468
],
[
108.855424,
19.469182
],
[
108.806148,
19.450561
],
[
108.765496,
19.400894
],
[
108.694047,
19.387346
],
[
108.644772,
19.349518
],
[
108.609048,
19.276661
],
[
108.591186,
19.141592
],
[
108.598577,
19.055633
],
[
108.630606,
19.003017
],
[
108.637997,
18.924346
],
[
108.595497,
18.872256
],
[
108.593033,
18.809386
],
[
108.65278,
18.740258
],
[
108.663866,
18.67337
],
[
108.641077,
18.565614
],
[
108.644772,
18.486738
],
[
108.68912,
18.447571
],
[
108.776583,
18.441894
],
[
108.881293,
18.416344
],
[
108.905315,
18.389087
],
[
108.944735,
18.314107
],
[
109.006329,
18.323198
],
[
109.108575,
18.323766
],
[
109.138756,
18.268081
],
[
109.17448,
18.260125
],
[
109.287813,
18.264671
],
[
109.355566,
18.215221
],
[
109.441182,
18.199303
],
[
109.467051,
18.173718
],
[
109.527413,
18.169169
],
[
109.584696,
18.143579
],
[
109.661688,
18.175424
],
[
109.726362,
18.177698
],
[
109.749767,
18.193618
],
[
109.785492,
18.339672
],
[
109.919767,
18.375457
],
[
110.022629,
18.360121
],
[
110.070672,
18.376025
],
[
110.090382,
18.399309
],
[
110.116867,
18.506602
],
[
110.214186,
18.578662
],
[
110.246215,
18.609859
],
[
110.329366,
18.642185
],
[
110.367555,
18.631977
],
[
110.499366,
18.651824
],
[
110.499366,
18.751592
],
[
110.578206,
18.784458
],
[
110.590525,
18.838841
],
[
110.585597,
18.88075
],
[
110.619474,
19.152334
],
[
110.676756,
19.286264
],
[
110.706321,
19.320153
],
[
110.729727,
19.378878
],
[
110.787009,
19.399765
],
[
110.844292,
19.449996
],
[
110.888023,
19.518827
],
[
110.920668,
19.552668
],
[
111.008747,
19.60398
],
[
111.061718,
19.612436
],
[
111.071573,
19.628784
],
[
111.043856,
19.763448
],
[
111.013675,
19.850159
],
[
110.966248,
20.018377
],
[
110.940994,
20.028499
],
[
110.871393,
20.01163
],
[
110.808567,
20.035808
],
[
110.778386,
20.068415
],
[
110.744509,
20.074036
],
[
110.717408,
20.148778
],
[
110.687843,
20.163947
],
[
110.655814,
20.134169
],
[
110.562191,
20.110006
],
[
110.526467,
20.07516
],
[
110.495054,
20.077408
],
[
110.387265,
20.113378
],
[
110.318279,
20.108882
],
[
110.28933,
20.056047
],
[
110.243135,
20.077408
],
[
110.144585,
20.074598
],
[
110.106396,
20.026812
]
]
]
]
}第二個問題:我想根據數據的多少來展示每個省份的顏色不同,而且縮略塊也不能是滑動的(最終效果已經在第一個上面展示了)。
其實縮略塊的配置在visualMap中的type配置上。而根據每個省份的顏色不同配置在visualMap中的pieces字段。代碼如下:
let myChart = echarts.init(document.getElementById('mapArea'))
  echarts.registerMap('china', chinaJson)
  const options = {
    tooltip: {
      trigger: 'item',
    },
    visualMap: {
      type: 'piecewise',
      right: 0,
      bottom: 0,
      orient: 'horizontal',
      itemWidth: 10,
      itemHeight: 10,
      pieces: [
        { min: 0, max: 10000, label: '0-10000', color: '#e5eeff' },
        { min: 10001, max: 20000, label: '10000-20000', color: '#a3c1ff' },
        { min: 20001, max: 30000, label: '20001-30000', color: '#769eff' },
        { min: 30001, max: 40000, label: '30001-40000', color: '#1a53ff' },
        { min: 40001, label: '40001以上', color: '#0d2eb7' },
      ],
      minOpen: false,
      showLabel: true,
      text: [],
      realtime: true,
      calculable: false,
      textStyle: {
        fontSize: 10,
      },
    },
    geo: {
      map: 'china',
      nameMap: '中國',
      roam: false,
      scaleLimit: {
        min: 1,
        max: 2,
      },
      zoom: 1.2,
      itemStyle: {
        areaColor: '#e5eeff',

        borderColor: '#1a53ff',
      },
      emphasis: {
        itemStyle: {
          areaColor: '#f8734f',
        },
        label: {
          show: false,
        },
      },

      tooltip: {
        show: true,
      },
      // selectedMode: 'single',
      label: {
        show: false,
        color: '#333',
        align: 'center',
        fontSize: 10,
      },
    },
    series: [
      {
        type: 'map',
        map: 'china',
        geoIndex: 0, // 這樣能同步上面的geo地圖,不會顯示兩個地圖,必須保持配置放大縮小也要一樣
        roam: false,
        scaleLimit: {
          min: 1,
          max: 2,
        },
        label: {
          show: false,
          color: '#333',
          align: 'center',
          fontSize: 10,
        },
        zoom: 1.2,
        itemStyle: {

          borderColor: '#1a53ff',
        },
        emphasis: {
          itemStyle: {
            areaColor: '#f8734f',
          },
          label: {
            show: false,
          },
        },
        data: [
          { name: '河南省', value: 20057.34 },
          { name: '山東省', value: 15477.48 },
          { name: '湖北省', value: 31686.1 },
          { name: '北京市', value: 6992.6 },
          { name: '湖南省', value: 44045.49 },
          { name: '廣東省', value: 40689.64 },
          { name: '廣西省', value: 37659.78 },
          { name: '陝西省', value: 45180.97 },
        ],
      },
    ],
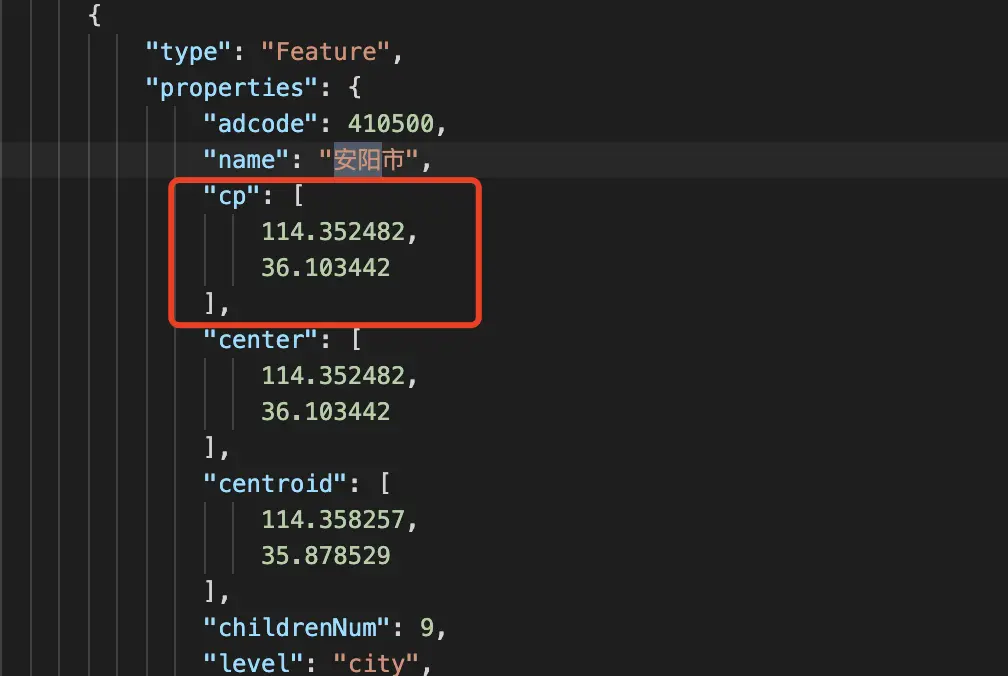
第三個問題:是做河南省份地圖的時候,需要顯示每個名字,但是【安陽】這個在地圖上位置錯位,讓人有誤會。
解決方法:是在json文件中在需要的市區加入cp:[經度,緯度]
 "type": "Feature",
            "properties": {
                "adcode": 410500,
                "name": "安陽市",
                "cp": [
                    114.352482,
                    36.103442
                ],
                "center": [
                    114.352482,
                    36.103442
                ],
                "centroid": [
                    114.358257,
                    35.878529
                ],
                "childrenNum": 9,
                "level": "city",
還有一個問題,投影加描邊框
我想邊框你們應該會,其實就是在itemStyle中加入border,主要是在投影上,其實也很簡單,就是多寫幾個地圖,位置錯開就行了,下次給你展示代碼


