


作者:張富春(ahfuzhang),轉載時請註明作者和引用鏈接,謝謝!
- cnblogs博客
- zhihu
- Github
- 公眾號:一本正經的瞎扯
![]()

我曾設計了這樣的 VictoriaMetrics 中的實時羣集和歷史羣集:
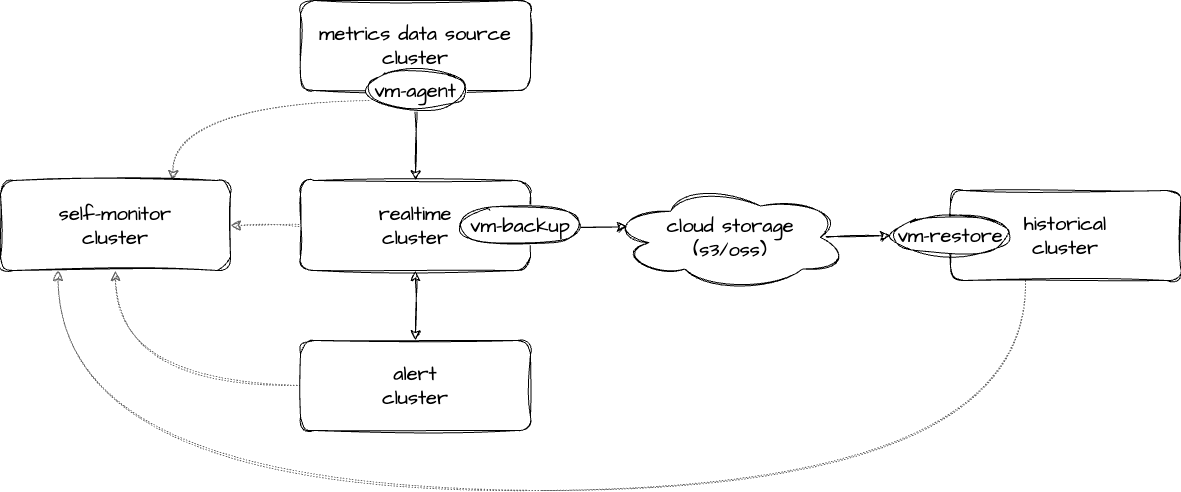
see: deploy_VictoriaMetrics_cluster
期待的效果是:
- 實時羣集存儲最近 7 天的數據,保障足夠快足夠可靠,提供告警查詢和當前的系統監控。
- 為了保障實時羣集的穩定性,通過犧牲存儲時間來減少存儲的數據
- 歷史羣集提供長週期的(例如半年),且降採樣的數據的存儲
- 以低成本的方式提供長週期的數據查詢
部署完成後,我部署了一個新的 vmselect 節點,來連接到所有的實時羣集和歷史羣集的vmselect節點上。
可是當我執行如下的查詢時,發現數據是正確數據的兩倍:
sum by (path) (increase(http_request_total{job="myApp"}[1m]))
很明顯, sum() 時,把實時羣集和歷史羣集中同樣的 time series 上的值加了兩次。
研究過 dedup 的源碼,並未發現明顯問題。
無奈,只能通過別的辦法繞過去。
於是想到:如果能夠自動發現用户查詢的時間範圍,當用户查詢七天以內時轉發到實時羣集,而查詢超過七天就轉到歷史羣集,那麼就不用把歷史羣集和實時羣集混合在一起了。
下面是這個思路的詳細解決辦法:
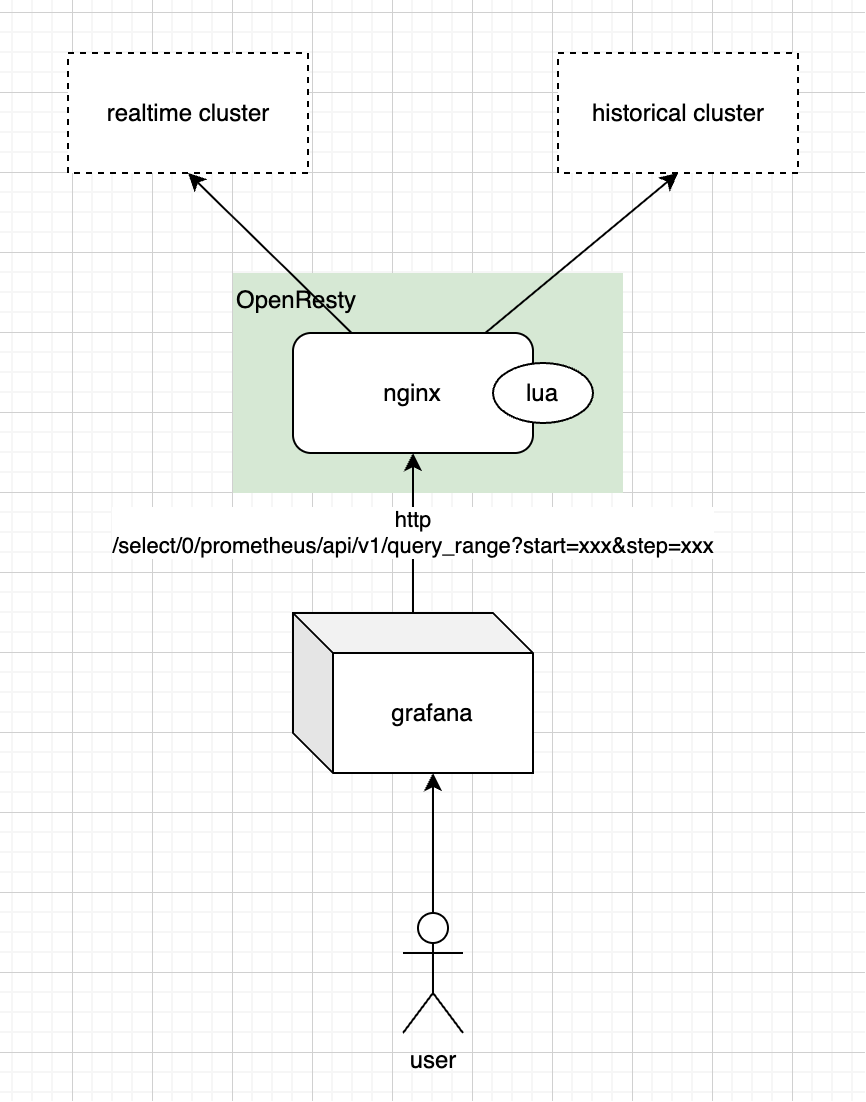
部署 openresty 的 deployment 的代碼如下:
# openresty.yaml

# nginx 的配置文件放在 configMap 中
apiVersion: v1
kind: ConfigMap
metadata:
  name: openresty-config
data:
  # nginx 的 配置文件
  nginx.conf: |
    worker_processes  1;

    events {
        worker_connections  1024;
    }

    http {
        access_log /dev/stdout;
        error_log /dev/stderr warn;

        lua_package_path "/usr/local/openresty/nginx/lua/?.lua;;";

        upstream realtime {
            server vmselect-realtime:8481;  # 實時羣集的 vmselect
        }

        upstream historical {
            server vmselect-historical:8481;  # 歷史羣集的 vmselect
        }

        server {
            listen 8401;

            location /select/0/prometheus/api/v1/query_range {  # 核心是修改 query_range 這條 api
                content_by_lua_file /usr/local/openresty/nginx/lua/router.lua;
            }
            # 其它所有路徑默認走 realtime
            location / {
                proxy_pass http://realtime;
            }

            location @toRealtime {
                proxy_pass http://realtime;
            }

            location @toHistorical {
                proxy_pass http://historical;
            }
        }
    }

  # lua 腳本的代碼
  router.lua: |
    -- 時間值要支持三種格式:數值,字符串,grafana中的簡寫
    local function parse_start(val)
        if not val then return nil end
        local num = tonumber(val)
        if num then
            if num > 1e12 then
                return math.floor(num / 1000)
            else
                return num
            end
        end

        local year, mon, day, hour, min, sec =
            val:match("^(%d+)%-(%d+)%-(%d+)T(%d+):(%d+):(%d+)")
        if year then
            return os.time({
                year = tonumber(year),
                month = tonumber(mon),
                day = tonumber(day),
                hour = tonumber(hour),
                min = tonumber(min),
                sec = tonumber(sec)
            })
        end

        local num, unit = val:match("^([%-]?%d+)([smhdw])$")
        if num and unit then
            num = tonumber(num)
            local seconds = 0
            if unit == "s" then seconds = num
            elseif unit == "m" then seconds = num * 60
            elseif unit == "h" then seconds = num * 3600
            elseif unit == "d" then seconds = num * 86400
            elseif unit == "w" then seconds = num * 7 * 86400
            end
            return ngx.time() + seconds
        end

        return nil
    end

    local args = ngx.req.get_uri_args()
    local is_post = (ngx.req.get_method() == "POST")
    local post_args = {}

    if is_post then
        ngx.req.read_body()
        post_args = ngx.req.get_post_args()
        for k,v in pairs(post_args) do
            args[k] = v
        end
    end

    local start = parse_start(args["start"])
    local now = ngx.time()
    local days = 7  -- 這裏設定一個七天的範圍:七天以內在實時羣集查詢,超過七天在歷史羣集查詢
    local n_days_ago = now - days*24*3600
    local step = "300s"  -- 當查詢歷史羣集時,使用歷史羣集的降採樣後的間隔,即 5 分鐘

    if start ~= nil then
        if start > n_days_ago then
            return ngx.exec("@toRealtime")
        else
            if is_post then
                post_args["step"] = step
                local body_tbl = {}
                for k,v in pairs(post_args) do
                    table.insert(body_tbl, ngx.escape_uri(k) .. "=" .. ngx.escape_uri(v))
                end
                local new_body = table.concat(body_tbl, "&")
                ngx.req.set_body_data(new_body)
            else
                args["step"] = step
                ngx.req.set_uri_args(args)
            end
            return ngx.exec("@toHistorical")
        end
    else
        return ngx.exec("@toRealtime")
    end
---
# 這裏是部署 openresty 的 deployment
apiVersion: apps/v1
kind: Deployment
metadata:
  name: openresty
spec:
  replicas: 1
  selector:
    matchLabels:
      app: openresty
  template:
    metadata:
      labels:
        app: openresty
    spec:
      containers:
        - name: openresty
          image: openresty/openresty:1.27.1.2-alpine
          ports:
            - containerPort: 8401
          volumeMounts:
            - name: config
              mountPath: /usr/local/openresty/nginx/conf/nginx.conf
              subPath: nginx.conf
            - name: config
              mountPath: /usr/local/openresty/nginx/lua/router.lua
              subPath: router.lua
          command: ["/usr/local/openresty/bin/openresty"]
          args: ["-g", "daemon off;", "-c", "/usr/local/openresty/nginx/conf/nginx.conf"]
      volumes:
        - name: config
          configMap:
            name: openresty-config
---
apiVersion: v1
kind: Service
metadata:
  name: openresty
spec:
  selector:
    app: openresty
  ports:
    - protocol: TCP
      port: 8401
      targetPort: 8401
  type: ClusterIP
通過命令行部署:
KUBECONFIG=~/my-test-k8s.yaml kubectl apply -f ./openresty.yaml -n my-namespace
通過 grafana 創建新的數據源,或者可以使用命令查詢:
curl -G "http://127.0.0.1:8401/select/0/prometheus/api/v1/query_range?start=-7d" -v
可以通過 header X-Server-Hostname 觀察數據由哪個服務返回。
Have Fun. 😃

