大屏項目指南
資源列表
1. echars官方文檔:[Apache ECharts](https://echarts.apache.org/zh/index.html)
 	1. api: [Api](https://echarts.apache.org/zh/api.html#echarts)
 	2. 配置項手冊:[Options](https://echarts.apache.org/zh/option.html#title)
 	3. 術語快查手冊:[術語速查手冊](https://echarts.apache.org/zh/cheat-sheet.html)
 	4. [echarts的渲染器ZRender](https://ecomfe.github.io/zrender-doc/public/)
 	5. [echarts源碼](https://github.com/apache/echarts)
 	6. ...
2. 示例網站大全
 	1. [PPChart - 讓圖表更簡單](https://ppchart.com/#/)
 	2. [makeapie echarts社區圖表可視化案例](https://www.makeapie.cn/echarts)
 	3. [MCChart](https://echarts.zhangmuchen.top/#/index)
 	4. [分享你我 - ECharts 作品集](http://chart.majh.top/)
 	5. [分享你的可視化作品isqqw.com](https://www.isqqw.com/)
 	6. [官網示例](https://demo.runoops.com/echarts-website/examples/zh/index.html#chart-type-line)
3. 其他免費資源
 	1. 阿里雲免費地圖數據下載:[DataV.GeoAtlas地理小工具系列](https://datav.aliyun.com/portal/school/atlas/area_selector)
 	2. 100套大屏可視化模板 (他這些都是jquery的項目,可以參考學習): [100+套大數據可視化炫酷大屏Html5模板;包含行業:社區、物業、政務、交通、金融銀行等,全網最新、最多,最全、最酷、最炫大數據可視化模板。陸續更新中](https://github.com/iGaoWei/BigDataView)
 	3. 數據可視化設計:[統計圖表 Chart | AntV](https://antv.antgroup.com/specification/graph/chart)
大屏項目佈局和響應式
-
頁面佈局就用Gird佈局(讓ai生成) CSS Grid 網格佈局教程 - 阮一峯的網絡日誌 ,CSS 網格佈局指南 | CSS-Tricks - CSS技巧
-
響應式用rem
-
echats中的尺寸可以自己寫個函數轉換一下:
-
場景是:在echarts的options配置的尺寸是固定的px,比如設置label的fontSize:14,這個14是固定的就是14px,這裏不會動態變化,當大分辨率下會顯得很小所以需要我們寫個函數處理下得到動態的結果
-
// 基於設計稿寬度自適應的函數
function autoSize(size) {
  const clientWidth = window.innerWidth || document.documentElement.clientWidth;
  const scale = clientWidth / 1920; // 1920是設計稿寬度
  return Math.round(size * scale);
}

// ECharts 配置示例
option = {
  title: {
    text: '自適應字體',
    textStyle: {
      fontSize: autoSize(20) // 20 是設計稿上寫的字號
    }
  },
  series: [
    {
      type: 'pie',
      label: {
        fontSize: autoSize(14)
      }
    }
  ]
};
-
echarts使用入門
-
下載echarts包 npm install echarts 即可
-
let chart = echarts.init()//初始化,要保證能夠拿到dom並且dom是可見的
-
設置初始option
-
綁定resize事件
-
綁定點擊事件
-
拿到數據後更新option
下面是封裝的一個class,框架無關
import charttheme from '../assets/charttheme.json';//主題文件,可在echarts官網自定義主題
import * as Chart from 'echarts';

class ChartClass {
  // 靜態屬性存儲已註冊的主題
  static registeredThemes = new Set();
    //默認配置項,可以在初始化圖標後設置,統一放在這個類的靜態屬性裏,提高複用性
  static defaultOption = {
      grid: {
        left: '3%',
        right: '4%',
        bottom: '10%',
        containlabel: true
      },
		//...
    };
  // 靜態方法註冊主題
  static registerTheme(themeName = 'infographic', themeConfig = charttheme) {
    if (!this.registeredThemes.has(themeName)) {
      Chart.registerTheme(themeName, themeConfig);
      this.registeredThemes.add(themeName);
    }
  }

  constructor(dom, theme = 'infographic', initOptions = {}) {
      //
     if(Chart.getInstanceByDom(dom))return//如果已經掛載就退出
    this.chart =  Chart.init(dom, theme, initOptions);
    this.dom = dom;
    this.observer = null;
    this.resizeObserver = null;


    // this.chart.setOption(this.defaultChartOptions)
    //DOM 監聽(用於銷燬時清理)
    //當dom銷燬時,進行清理操作
    this._initObserver();
    // 初始化尺寸監聽
    this._initResizeObserver();
  }

  setOption(options) {
    // 合併默認配置和傳入的配置
    const mergedOptions = Object.assign({}, this.defaultchartoptions, options);
    this.chart.setOption(mergedOptions, true);
  }

  dispose() {
    if (this.chart) {
      this.chart.dispose();
      this.chart = null;
    }

    if (this.observer) {
      this.observer.disconnect();
      this.observer = null;
    }

    if (this.resizeObserver) {
      this.resizeObserver.disconnect();
      this.resizeObserver = null;
    }
  }
  dispatchAction(){
    this.chart.dispatchAction(...arguments);
  }
  _initObserver() {
    const parent = this.dom.parentNode;

    if (!parent) {
      this.dispose();
      return;
    }

    const observer = new MutationObserver((mutations) => {
      for (const mutation of mutations) {
        if (mutation.type === 'childList') {
          // 檢查被移除的節點中是否包含當前圖表DOM
          for (const removedNode of mutation.removedNodes) {
            if (removedNode.contains(this.dom) || removedNode === this.dom) {
              this.dispose();
              observer.disconnect();
              return;
            }
          }

          // 同時檢查DOM是否仍在文檔中
          if (!document.body.contains(this.dom)) {
            this.dispose();
            observer.disconnect();
            return;
          }
        }
      }
    });

    // 修改觀察選項,增加subtree以監聽所有子節點變化
    observer.observe(document.body, {
      childList: true,
      subtree: true
    });

    this.observer = observer;
  }

  _initResizeObserver() {
    // const resizeObserver = new ResizeObserver(() => {
    //   if (this.chart && !this.chart.isDisposed()) {
    //     this.chart.resize();
    //   }
    // });

    // resizeObserver.observe(this.dom);

    // this.resizeObserver = resizeObserver;

    window.addEventListener('resize', () => {
      if (this.chart && !this.chart.isDisposed()) {
        console.log("窗口尺寸變化");


        this.chart.resize();
      }
    });

  }
}

// 靜態方法調用:類初始化時註冊主題
// ChartClass.registerTheme();

export default ChartClass;
使用
import ChartClass from './chartClass';

export default function sandian(dom) {
    // 根據百分比計算背景色
    function getBackgroundColor(percentStr) {
        const percent = parseFloat(percentStr.replace('%', ''));
        if (percent >= 60) return '#ff4757';  // 紅色(高百分比)
        if (percent >= 20) return '#ffa726';  // 橙色(中等百分比)
        return '#42a5f5';  // 藍色(低百分比)
    }

    function getBorderColor(percentStr) {
        const percent = parseFloat(percentStr.replace('%', ''));
        if (percent >= 60) return '#ff3742';
        if (percent >= 20) return '#ff9800';
        return '#2196f3';
    }

    var data2 = [
        {
            name: "馬雲馬老闆",
            children: [
                {
                    //子集
                    name: "北京國風信通科技有限公司",
                    value: "控股",
                    percent: "60%",
                    money: "120萬元",
                    bgColor: getBackgroundColor("60%"),
                    borderColor: getBorderColor("60%")
                },
                {
                    name: "北京阿里巴巴信息技術有限公司",
                    value: "控股",
                    percent: "1.43%",
                    money: "800萬元",
                    bgColor: getBackgroundColor("1.43%"),
                    borderColor: getBorderColor("1.43%")
                },
                {
                    name: "高德軟件有限公司",
                    value: "控股",
                    percent: "67%",
                    money: "16242.4242萬元",
                    bgColor: getBackgroundColor("67%"),
                    borderColor: getBorderColor("67%")
                },
                {
                    name: "杭州大井頭貳拾貳號文化藝術有限公司",
                    value: "控股",
                    percent: "99%",
                    money: "990萬元",
                    bgColor: getBackgroundColor("99%"),
                    borderColor: getBorderColor("99%")
                },
            ],
        },
    ];
    var chartDom = dom
    var myChart = new ChartClass(chartDom);

    var option;

    option = {
        tooltip: {
            trigger: "item",
            formatter: "{b}",
        },
        series: [
            {
                type: "tree",
                name: "股權穿透圖",
                edgeShape: "polyline", //鏈接線是折現還是曲線
                orient: "TB",
                data: data2,
                width: 1000,
                height: 200,
                top: "30%",
                left: "5%",
                symbolSize: 1,
                initialTreeDepth: 10,
                hoverAnimation: false, // 禁用懸停動畫
                label: {
                    // show: false,

                    position: [-80, 10],  // 調整位置以適應更寬的標籤
                    verticalAlign: "middle",
                    align: "left",
                    backgroundColor: "#0084ff",
                    color: "#fff",
                    padding: [15, 20, 15, 20],  // 上右下左的內邊距
                    borderWidth: 2,
                    borderColor: "#0070d9",
                    fontWeight: "bold",
                    fontSize: 14,  // 減小字體以適應更多文本
                    minMargin: 15,  // 增加最小邊距避免重疊
                    width: 120,  // 設置固定寬度
                    height: 40,   // 設置固定高度
                    overflow: 'break',  // 文本換行而不是截斷
                    lineHeight: 16,  // 設置行高
                    // formatter: function(params) {
                    //     // 自定義格式器,確保文本適應寬度
                    //     return params.name;
                    // }
                },
                leaves: {
                    label: {
                        // show: false,
                        position: [-120, 40],
                        verticalAlign: "middle",
                        align: "left",
                        color: "#fff",
                        padding: [15, 20, 15, 20],
                        borderWidth: 2,
                        width: 200,
                        height: 50,
                        fontSize: 12,
                        fontWeight: "bold",
                        overflow: 'truncate',
                        lineHeight: 14,
                        ellipsis: '...',
                        formatter: function (params) {
                            const percent = params.data.percent || '0%';
                            const money = params.data.money || '';
                            // const value = params.data.value || '';
                            const name = params?.name || '';
                            let bg = parseInt(money) >= 1000 ? 'red' : 'container';
                            return `{${bg}|${name}}\n{${bg}|${percent}}\n{${bg}|${money}}`;

                        },
                        backgroundColor: 'transparent',
                        borderColor: "transparent",
                        rich: {
                            container: {
                                backgroundColor: "#0084ff",
                                // borderColor: "#e0e0e0",
                                borderWidth: 1,
                                // borderRadius: 6,
                                padding: [20, 15],
                                width: 200,
                                lineHeight: 30,
                                // lineHeight: 14,
                            },
                            red: {
                                backgroundColor: "#ff4757",

                                // borderColor: "#e0e0e0",
                                borderWidth: 1,
                                // borderRadius: 6,
                                padding: [20, 15],
                                width: 200,
                                lineHeight: 30,
                            }
                        }

                    }
                },


                lineStyle: {
                    color: "#9b97beff",
                },
                expandAndCollapse: false,
                animationDuration: 550,
                animationDurationUpdate: 750,
            },
        ],
    };

    option && myChart.setOption(option);


    //可以通過他的內部api得到座標,然後通過graphic覆蓋來自定義節點形狀等


    // myChart.chart.on('finished', function () {
    //     var seriesModel = myChart.chart.getModel().getSeriesByIndex(0);
    //     var data = seriesModel.getData();

    //     // 清空舊的 graphic
    //     //   myChart.chart.setOption({ graphic: [] });
    //     let graphic = [

    //     ]
    //     // 遍歷所有節點並添加背景矩形 + 文本
    //     data._graphicEls.forEach((el, index) => {

    //         const layout = { x: 0, y: 0 }
    //         layout.x = el.transform[4]
    //         layout.y = el.transform[5]


    //         if (!layout) return
    //         // 使用 graphic 繪製背景和文本
    //         const groupName = data._idList[index];
    //         // 創建圖形組
    //         const graphicGroup = {
    //             type: 'group',
    //             name: groupName, // 分組名稱,用於後續查找
    //             id: `group_${index}`, // 唯一標識
    //             position: [layout.x, layout.y], // 組定位(替代單個元素定位)
    //             children: [
    //                 // 第一個圖特殊處理:矩形改為橢圓並設置黃色
    //                 index === 2 ? {
    //                     type: 'ellipse',  // 將矩形改為橢圓
    //                     z: 1000,
    //                     shape: {
    //                         cx: 0,       // 橢圓中心x座標(相對於組原點)
    //                         cy: 0,       // 橢圓中心y座標(相對於組原點)
    //                         rx: 80,      // x軸半徑(原矩形寬度的一半)
    //                         ry: 20       // y軸半徑(原矩形高度的一半)
    //                     },
    //                     style: {
    //                         fill: 'rgba(141, 141, 25, 1)',  // 黃色填充
    //                         stroke: 'rgba(0, 0, 0, 0.5)',
    //                         borderRadius: 20  // 可選:添加圓角增強橢圓效果
    //                     }
    //                 } : {
    //                     // 其他節點保持原矩形樣式
    //                     type: 'rect',
    //                     z: 1000,
    //                     shape: {
    //                         x: -80, // 相對於組的偏移量
    //                         y: -20,
    //                         width: 160,
    //                         height: 40,
    //                     },
    //                     style: {
    //                         fill: 'rgba(80, 113, 184, 1)',
    //                         stroke: 'rgba(0, 0, 0, 0.5)',
    //                     }
    //                 },
    //                 // 文本元素(可選)
    //                 {
    //                     type: 'text',
    //                     z: 1001,
    //                     style: {
    //                         text: (groupName || '未命名').length > 8 ?
    //                             (groupName || '未命名').slice(0, 8) + '...' :
    //                             (groupName || '未命名'),
    //                         fontSize: 12,
    //                         fill: '#fff',
    //                         // 將textAlign和textVerticalAlign替換為正確的對齊屬性
    //                         align: 'center',         // 水平居中
    //                         verticalAlign: 'middle'  // 垂直居中
    //                     },
    //                     // 文本元素定位(相對於組原點)
    //                     left: -60,  // 組原點已在矩形中心
    //                     top: -5,

    //                 }
    //             ]
    //         };

    //         graphic.push(graphicGroup);

    //     });
    //     myChart.chart.setOption({
    //         graphic: graphic
    //     });
    // });

    return myChart
}
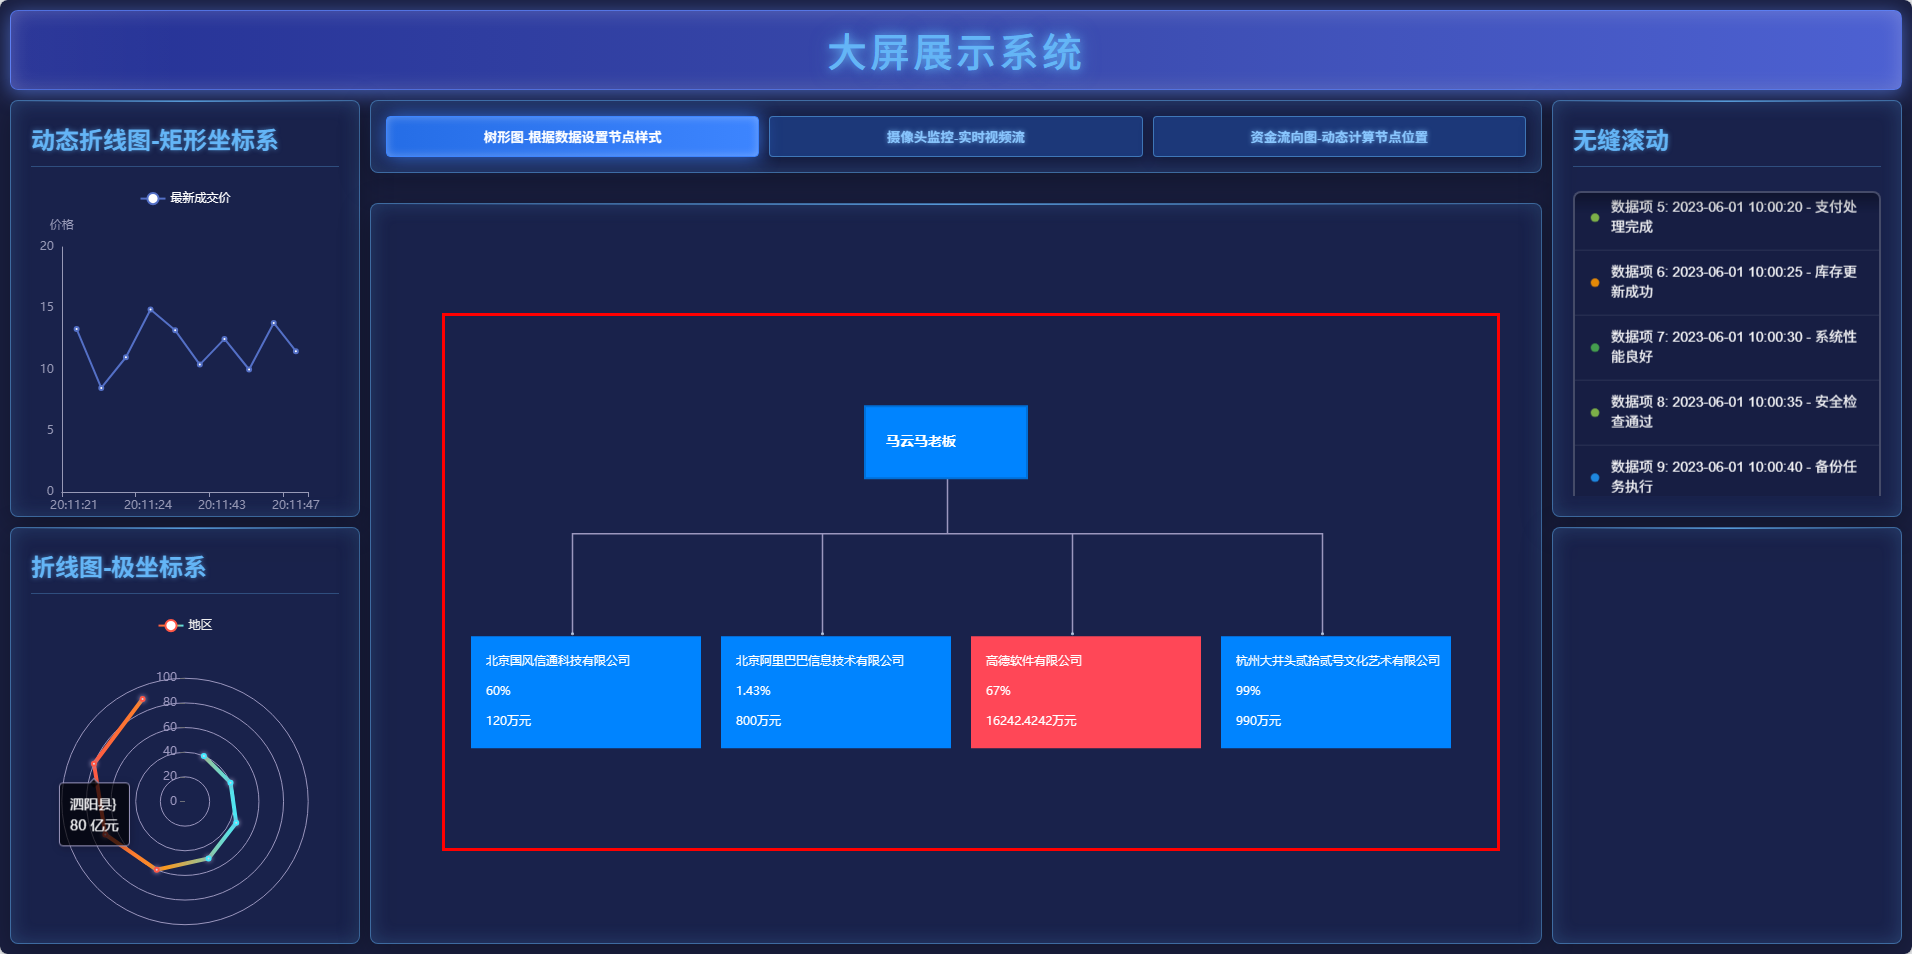
效果圖
整個項目的代碼地址: dty/bigViewReact
重要概念
術語快查手冊:術語速查手冊

Option(配置項 → 就是一份“圖表説明書”,告訴 ECharts 要畫什麼樣的圖。
Series(系列) → 決定畫哪種圖(柱狀圖/折線圖/餅圖)和用哪些數據。系列和維度是正交關係
Dataset(數據集) → 把原始數據統一放在一個表裏,方便多個圖表共享使用。只適合特定座標系
Dimension(維度) → 數據表的“列”,決定某個字段用來當 x 軸、y 軸還是提示信息。
Coordinate System(座標系) → 數據擺放的空間,比如直角座標、極座標、地圖。
Component(組件) → 圖表上的配件,比如標題、圖例、提示框、縮放條。
Visual Encoding(視覺編碼) → 數據轉成圖形的規則,比如數值大小對應柱子高度或顏色深淺。
Event & Action(事件與動作) → 圖表的交互機制,你點一下圖表,它能給你反饋或執行操作
不同圖標的統計特性
| 圖表類型 | 統計特性 | 適合場景 |
|---|---|---|
| 柱狀圖 (Bar Chart) | 比較不同類別的數據大小 | 各地區銷量對比、部門業績 |
| 折線圖 (Line Chart) | 數據隨時間的趨勢變化 | 股票走勢、網站流量、温度變化 |
| 餅圖 / 環形圖 (Pie/Donut Chart) | 整體中各部分的佔比 | 市場份額、支出結構、人口分佈 |
| 散點圖 (Scatter Plot) | 兩個變量之間的相關性、分佈 | 學習時間 vs 成績、廣告費 vs 銷售額 |
| 雷達圖 (Radar Chart) | 多維度指標對比 | 運動員能力、公司競爭力 |
| 堆疊圖 (Stacked Bar/Line) | 整體及部分隨時間的變化 | 渠道銷售額趨勢、能源消耗結構 |
| 熱力圖 (Heatmap) | 二維空間上的數值密度分佈 | 點擊熱區、時間-地點活動頻率 |
| 關係圖 (Graph) | 節點之間的連接關係 | 社交網絡、知識圖譜、網絡拓撲 |
| 地圖 (Geo/Map) | 地理空間分佈 | 各省 GDP、疫情分佈、物流覆蓋 |
| 箱線圖 (Boxplot) | 數據分佈特徵(中位數、離散度、異常值) | 工資分佈、考試成績差異、實驗數據分析 |